ENERGY IS NO JOKE

THE CARTOONS

8-4-08 - Joe and I watched the Larry King show tonight, and one of the experts was T. Boone Pickens.  After I went to sleep, I had 5 dream visions of cartoons. Each one represented some aspect of energy available to humanity.   The last one was a short train, and a voice said, "Here comes the train out of the desert".
 

Friday, January 30, 2004 by CommonDreams.org

How Global Warming May Cause the Next Ice Age...

by Thom Hartmann

While global warming is being officially ignored by the political arm of the Bush administration, and Al Gore's recent conference on the topic during one of the coldest days of recent years provided joke fodder for conservative talk show hosts, the citizens of Europe and the Pentagon are taking a new look at the greatest danger such climate change could produce for the northern hemisphere - a sudden shift into a new ice age. What they're finding is not at all comforting.

In quick summary, if enough cold, fresh water coming from the melting polar ice caps and the melting glaciers of Greenland flows into the northern Atlantic, it will shut down the Gulf Stream, which keeps Europe and northeastern North America warm. The worst-case scenario would be a full-blown return of the last ice age - in a period as short as 2 to 3 years from its onset - and the mid-case scenario would be a period like the "little ice age" of a few centuries ago that disrupted worldwide weather patterns leading to extremely harsh winters, droughts, worldwide desertification, crop failures, and wars around the world.

Here's how it works.

If you look at a globe, you'll see that the latitude of much of Europe and Scandinavia is the same as that of Alaska and permafrost-locked parts of northern Canada and central Siberia. Yet Europe has a climate more similar to that of the United States than northern Canada or Siberia. Why?

It turns out that our warmth is the result of ocean currents that bring warm surface water up from the equator into northern regions that would otherwise be so cold that even in summer they'd be covered with ice. The current of greatest concern is often referred to as "The Great Conveyor Belt," which includes what we call the Gulf Stream.

The Great Conveyor Belt, while shaped by the Coriolis effect of the Earth's rotation, is mostly driven by the greater force created by differences in water temperatures and salinity. The North Atlantic Ocean is saltier and colder than the Pacific, the result of it being so much smaller and locked into place by the Northern and Southern American Hemispheres on the west and Europe and Africa on the east.

As a result, the warm water of the Great Conveyor Belt evaporates out of the North Atlantic leaving behind saltier waters, and the cold continental winds off the northern parts of North America cool the waters. Salty, cool waters settle to the bottom of the sea, most at a point a few hundred kilometers south of the southern tip of Greenland, producing a whirlpool of falling water that's 5 to 10 miles across. While the whirlpool rarely breaks the surface, during certain times of year it does produce an indentation and current in the ocean that can tilt ships and be seen from space (and may be what we see on the maps of ancient mariners).

This falling column of cold, salt-laden water pours itself to the bottom of the Atlantic, where it forms an undersea river forty times larger than all the rivers on land combined, flowing south down to and around the southern tip of Africa, where it finally reaches the Pacific. Amazingly, the water is so deep and so dense (because of its cold and salinity) that it often doesn't surface in the Pacific for as much as a thousand years after it first sank in the North Atlantic off the coast of Greenland.

The out-flowing undersea river of cold, salty water makes the level of the Atlantic slightly lower than that of the Pacific, drawing in a strong surface current of warm, fresher water from the Pacific to replace the outflow of the undersea river. This warmer, fresher water slides up through the South Atlantic, loops around North America where it's known as the Gulf Stream, and ends up off the coast of Europe. By the time it arrives near Greenland, it's cooled off and evaporated enough water to become cold and salty and sink to the ocean floor, providing a continuous feed for that deep-sea river flowing to the Pacific.

These two flows - warm, fresher water in from the Pacific, which then grows salty and cools and sinks to form an exiting deep sea river - are known as the Great Conveyor Belt.

Amazingly, the Great Conveyor Belt is only thing between comfortable summers and a permanent ice age for Europe and the eastern coast of North America.

Much of this science was unknown as recently as twenty years ago. Then an international group of scientists went to Greenland and used newly developed drilling and sensing equipment to drill into some of the world's most ancient accessible glaciers. Their instruments were so sensitive that when they analyzed the ice core samples they brought up, they were able to look at individual years of snow. The results were shocking.

Prior to the last decades, it was thought that the periods between glaciations and warmer times in North America, Europe, and North Asia were gradual. We knew from the fossil record that the Great Ice Age period began a few million years ago, and during those years there were times where for hundreds or thousands of years North America, Europe, and Siberia were covered with thick sheets of ice year-round. In between these icy times, there were periods when the glaciers thawed, bare land was exposed, forests grew, and land animals (including early humans) moved into these northern regions.

Most scientists figured the transition time from icy to warm was gradual, lasting dozens to hundreds of years, and nobody was sure exactly what had caused it. (Variations in solar radiation were suspected, as were volcanic activity, along with early theories about the Great Conveyor Belt, which, until recently, was a poorly understood phenomenon.)

Looking at the ice cores, however, scientists were shocked to discover that the transitions from ice age-like weather to contemporary-type weather usually took only two or three years. Something was flipping the weather of the planet back and forth with a rapidity that was startling.

It turns out that the ice age versus temperate weather patterns weren't part of a smooth and linear process, like a dimmer slider for an overhead light bulb. They are part of a delicately balanced teeter-totter, which can exist in one state or the other, but transits through the middle stage almost overnight. They more resemble a light switch, which is off as you gradually and slowly lift it, until it hits a mid-point threshold or "breakover point" where suddenly the state is flipped from off to on and the light comes on.

It appears that small (less that .1 percent) variations in solar energy happen in roughly 1500-year cycles. This cycle, for example, is what brought us the "Little Ice Age" that started around the year 1400 and dramatically cooled North America and Europe (we're now in the warming phase, recovering from that). When the ice in the Arctic Ocean is frozen solid and locked up, and the glaciers on Greenland are relatively stable, this variation warms and cools the Earth in a very small way, but doesn't affect the operation of the Great Conveyor Belt that brings moderating warm water into the North Atlantic.

In millennia past, however, before the Arctic totally froze and locked up, and before some critical threshold amount of fresh water was locked up in the Greenland and other glaciers, these 1500-year variations in solar energy didn't just slightly warm up or cool down the weather for the landmasses bracketing the North Atlantic. They flipped on and off periods of total glaciation and periods of temperate weather.

And these changes came suddenly.

For early humans living in Europe 30,000 years ago - when the cave paintings in France were produced - the weather would be pretty much like it is today for well over a thousand years, giving people a chance to build culture to the point where they could produce art and reach across large territories.

And then a particularly hard winter would hit.

The spring would come late, and summer would never seem to really arrive, with the winter snows appearing as early as September. The next winter would be brutally cold, and the next spring didn't happen at all, with above-freezing temperatures only being reached for a few days during August and the snow never completely melting. After that, the summer never returned: for 1500 years the snow simply accumulated and accumulated, deeper and deeper, as the continent came to be covered with glaciers and humans either fled or died out. (Neanderthals, who dominated Europe until the end of these cycles, appear to have been better adapted to cold weather than Homo sapiens.)

What brought on this sudden "disappearance of summer" period was that the warm-water currents of the Great Conveyor Belt had shut down. Once the Gulf Stream was no longer flowing, it only took a year or three for the last of the residual heat held in the North Atlantic Ocean to dissipate into the air over Europe, and then there was no more warmth to moderate the northern latitudes. When the summer stopped in the north, the rains stopped around the equator: At the same time Europe was plunged into an Ice Age, the Middle East and Africa were ravaged by drought and wind-driven firestorms. .

If the Great Conveyor Belt, which includes the Gulf Stream, were to stop flowing today, the result would be sudden and dramatic. Winter would set in for the eastern half of North America and all of Europe and Siberia, and never go away. Within three years, those regions would become uninhabitable and nearly two billion humans would starve, freeze to death, or have to relocate. Civilization as we know it probably couldn't withstand the impact of such a crushing blow.

And, incredibly, the Great Conveyor Belt has hesitated a few times in the past decade. As William H. Calvin points out in one of the best books available on this topic ("A Brain For All Seasons: human evolution & abrupt climate change"): ".the abrupt cooling in the last warm period shows that a flip can occur in situations much like the present one. What could possibly halt the salt-conveyor belt that brings tropical heat so much farther north and limits the formation of ice sheets? Oceanographers are busy studying present-day failures of annual flushing, which give some perspective on the catastrophic failures of the past. "In the Labrador Sea, flushing failed during the 1970s, was strong again by 1990, and is now declining. In the Greenland Sea over the 1980s salt sinking declined by 80 percent. Obviously, local failures can occur without catastrophe - it's a question of how often and how widespread the failures are - but the present state of decline is not very reassuring."

Most scientists involved in research on this topic agree that the culprit is global warming, melting the icebergs on Greenland and the Arctic icepack and thus flushing cold, fresh water down into the Greenland Sea from the north. When a critical threshold is reached, the climate will suddenly switch to an ice age that could last minimally 700 or so years, and maximally over 100,000 years.

And when might that threshold be reached? Nobody knows - the action of the Great Conveyor Belt in defining ice ages was discovered only in the last decade. Preliminary computer models and scientists willing to speculate suggest the switch could flip as early as next year, or it may be generations from now. It may be wobbling right now, producing the extremes of weather we've seen in the past few years.

What's almost certain is that if nothing is done about global warming, it will happen sooner rather than later.

This article was adapted from the new, updated edition of "The Last Hours of Ancient Sunlight" by Thom Hartmann (thom at thomhartmann.com), due out from Random House/Three Rivers Press in March. www.thomhartmann.com

Copyright 2004 by Thom Hartmann.


  • Solar energy doesn't pollute or produce greenhouse gasses; and it doesn't deplete our finite energy resources.
  • Solar is clean and safe. There are no tanks containing flammable materials and no chemical odors.
  • Solar energy is reliable. It is not affected by political and economic turmoil, so your supply is assured.
  • Using solar reduces our dangerous dependence upon foreign energy sources.
  • And solar energy is free. Once you have purchased and installed a system, your heat is practically free, with only minimal electricity required to run the pumps that circulate heated water through the system.

Solar Heating Basics

Photo of a two solar collectors on a roof.

These solar collectors are part of the solar domestic hot water system. View a slide show on solar heating.

Solar heat can be used for solar water heating, solar space heating in buildings, and solar pool heaters.

Solar water heaters and solar space heaters are constructed of solar collectors, and all systems have some kind of storage, except solar pool heaters and some industrial systems that use energy "immediately." The systems collect the sun's energy to heat air or a fluid. The air or fluid then transfers solar heat directly to a building, water, or pool.

Solar heating is the usage of solar energy to provide process, space or water heating. See also Solar thermal energy. The heating of water is covered in solar hot water. Solar heating design is divided into two groups:
  • Passive solar heating does not require electrical or mechanical equipment, and may rely on the design and structure of the house to collect, store and distribute heat throughout the building (passive solar building design).

How solar heating works

A household solar heating system consists of a solar panel (or solar collector) with a heat transfer fluid flowing through it to transport the heat energy collected to somewhere useful, usually a hot water tank or household radiators. The solar panel is located somewhere with good light levels throughout the day, often on the roof of the building. A pump pushes the heat transfer liquid (often just treated water) through the panel. The heat is thus taken from the panel and transferred to a storage cylinder.

Other uses

Solar heating also refers to the heating of any objects, including buildings, cars, through solar radiation. Solar heating depends on the solar radiation, surface area, surface reflectance, surface emissivity, ambient temperature, and thermal convection from wind. With most all objects on Earth, solar heating reaches a state of temperature equilibrium as the heat imparted by the sun is offset by the heat given off through reflection, radiation, and convection. White objects stay dramatically cooler than other objects because the most important variables are characteristics of the surface, reflectance, emissivity, convection and surface area. Silvery objects get hot even though they are excellent reflectors because they are very poor in heat emission. Human skin, and many other living surfaces, like tree leaves, have near perfect emissivity (~1.0), and so stay pretty cool. A perfect sunscreen is a dye that perfectly absorbs, with high emissivity, or perfectly reflects, ultraviolet and infrared while being transparent in visible light.

It is worth noting that it is impossible for any material to be a good absorber of a given frequency and at the same time a poor emitter of the same frequency ( or the other way around). The difference in absorption and emission arises because the radiation emitted by a relatively cold object like a human, has much lower frequency than the radiation emitted by a hot object like the sun. Materials which have high emissivity for low frequencies but high absorption at higher frequencies will therefore stay much cooler than materials which have high absorption of high frequencies and low emission of low frequency.

The United States is way behind the other large countries in the usage of solar for energy:
 
Solar Hot Water Installed Capacity 2005
Country million m2 GWth
China 79.3 55.5
EU 16.0 11.2
Turkey 8.1 5.7
Japan 7.2 5.0
Israel 4.7 3.3
Brazil 2.3 1.6
United States 2.3 1.6
Australia 1.7 1.2
India 1.5 1.1
World 125 88


Wind power is the conversion of wind energy into a useful form, such as electricity, using wind turbines. At the end of 2007, worldwide capacity of wind-powered generators was 94.1 gigawatts. Although wind currently produces about 1% of world-wide electricity use,  it accounts for approximately 19% of electricity production in Denmark, 9% in Spain and Portugal, and 6% in Germany and the Republic of Ireland (2007 data). Globally, wind power generation increased more than fivefold between 2000 and 2007.[1]

Most wind power is generated in the form of electricity. Large scale wind farms are connected to electrical grids. Individual turbines can provide electricity to isolated locations. In windmills, wind energy is used directly as mechanical energy for pumping water or grinding grain.

Wind energy is plentiful, renewable, widely distributed, clean, and reduces greenhouse gas emissions when it displaces fossil-fuel-derived electricity. The intermittency of wind seldom creates problems when using wind power to supply a low proportion of total demand. Where wind is to be used for a moderate fraction of demand, additional costs for compensation of intermittency are considered to be modest.

The earliest historical reference to a rudimentary windmill was used to power an organ in the 1st century AD. The first practical windmills were later built in Sistan, Afghanistan, from the 7th century. These were vertical-axle windmills, which had long vertical driveshafts with rectangle shaped blades. Made of six to twelve sails covered in reed matting or cloth material, these windmills were used to grind corn and draw up water, and were used in the gristmilling and sugarcane industries. Horizontal-axle windmills were later used extensively in Northwestern Europe to grind flour beginning in the 1180s, and many Dutch windmills still exist.

In the United States, the development of the "water-pumping windmill" was the major factor in allowing the farming and ranching of vast areas of North America, which were otherwise devoid of readily accessible water. They contributed to the expansion of rail transport systems throughout the world, by pumping water from wells to supply the needs of the steam locomotives of those early times.

The multi-bladed wind turbine atop a lattice tower made of wood or steel was, for many years, a fixture of the landscape throughout rural America.

The modern wind turbine was developed beginning in the 1980s, although designs are still under development.

Wind energy

For more details on this topic, see Wind.

The origin of wind is complex. The Earth is unevenly heated by the sun resulting in the poles receiving less energy from the sun than the equator does. Also the dry land heats up (and cools down) more quickly than the seas do. The differential heating drives a global atmospheric convection system reaching from the Earth's surface to the stratosphere which acts as a virtual ceiling. Most of the energy stored in these wind movements can be found at high altitudes where continuous wind speeds of over 160 km/h (100 mph) occur. Eventually, the wind energy is converted through friction into diffuse heat throughout the Earth's surface and the atmosphere.

There is an estimated 72 TW of wind energy on the Earth that potentially can be commercially viable.  Not all the energy of the wind flowing past a given point can be recovered (see Betz' law).

Distribution of wind speed

Distribution of wind speed (red) and energy (blue) for all of 2002 at the Lee Ranch facility in Colorado. The histogram shows measured data, while the curve is the Rayleigh model distribution for the same average wind speed. Energy is the Betz limit through a 100 meter diameter circle facing directly into the wind. Total energy for the year through that circle was 15.4 gigawatt-hours.

Windiness varies, and an average value for a given location does not alone indicate the amount of energy a wind turbine could produce there. To assess the frequency of wind speeds at a particular location, a probability distribution function is often fit to the observed data. Different locations will have different wind speed distributions. The Rayleigh model closely mirrors the actual distribution of hourly wind speeds at many locations.

Because so much power is generated by higher windspeed, much of the energy comes in short bursts. The 2002 Lee Ranch sample is telling; half of the energy available arrived in just 15% of the operating time. The consequence is that wind energy does not have as consistent an output as fuel-fired power plants; utilities that use wind power must provide backup generation for times that the wind is weak. Making wind power more consistent requires that storage technologies must be used to retain the large amount of power generated in the bursts for later use.

Worldwide installed capacity 1997-2007, with projection 2008-2013 based on an exponential fit. Data source: WWEA

Grid management

Induction generators often used for wind power projects require reactive power for excitation, so substations used in wind-power collection systems include substantial capacitor banks for power factor correction. Different types of wind turbine generators behave differently during transmission grid disturbances, so extensive modelling of the dynamic electromechanical characteristics of a new wind farm is required by transmission system operators to ensure predictable stable behaviour during system faults. In particular, induction generators cannot support the system voltage during faults, unlike steam or hydro turbine-driven synchronous generators (however properly matched power factor correction capacitors along with electronic control of resonance can support induction generation without grid). Doubly-fed machines, or wind turbines with solid-state converters between the turbine generator and the collector system, have generally more desirable properties for grid interconnection. Transmission systems operators will supply a wind farm developer with a grid code to specify the requirements for interconnection to the transmission grid. This will include power factor, constancy of frequency and dynamic behaviour of the wind farm turbines during a system fault.

Capacity factor

Since wind speed is not constant, a wind farm's annual energy production is never as much as the sum of the generator nameplate ratings multiplied by the total hours in a year. The ratio of actual productivity in a year to this theoretical maximum is called the capacity factor. Typical capacity factors are 20-40%, with values at the upper end of the range in particularly favourable sites. For example, a 1 megawatt turbine with a capacity factor of 35% will not produce 8,760 megawatt-hours in a year (1x24x365), but only 0.35x24x365 = 3,066 MWh, averaging to 0.35 MW. Online data is available for some locations and the capacity factor can be calculated from the yearly output.

Unlike fueled generating plants, the capacity factor is limited by the inherent properties of wind. Capacity factors of other types of power plant are based mostly on fuel cost, with a small amount of downtime for maintenance. Nuclear plants have low incremental fuel cost, and so are run at full output and achieve a 90% capacity factor. Plants with higher fuel cost are throttled back to follow load. Gas turbine plants using natural gas as fuel may be very expensive to operate and may be run only to meet peak power demand. A gas turbine plant may have an annual capacity factor of 5-25% due to relatively high energy production cost.

According to a 2007 Stanford University study published in the Journal of Applied Meteorology and Climatology, interconnecting ten or more wind farms allows 33 to 47% of the total energy produced to be used as reliable, baseload electric power, as long as minimum criteria are met for wind speed and turbine height.

Intermittency and penetration limits

Electricity generated from wind power can be highly variable at several different timescales: from hour to hour, daily, and seasonally. Annual variation also exists, but is not as significant. Because instantaneous electrical generation and consumption must remain in balance to maintain grid stability, this variability can present substantial challenges to incorporating large amounts of wind power into a grid system. Intermittency and the non-dispatchable nature of wind energy production can raise costs for regulation, incremental operating reserve, and (at high penetration levels) could require energy demand management, load shedding, or storage solutions. At low levels of wind penetration, fluctuations in load and allowance for failure of large generating units requires reserve capacity that can also regulate for variability of wind generation.

Pumped-storage hydroelectricity or other forms of grid energy storage can store energy developed by high-wind periods and release it when needed.Stored energy increases the economic value of wind energy since it can be shifted to displace higher cost generation during peak demand periods. The potential revenue from this arbitrage can offset the cost and losses of storage; the cost of storage may add 25% to the cost of wind energy.

Peak wind speeds may not coincide with peak demand for electrical power. In California and Texas, for example, hot days in summer may have low wind speed and high electrical demand due to air conditioning. In the UK, however, winter demand is higher than summer demand, and so are wind speeds. Solar power tends to be complementary to wind; on most days with no wind there is sun and on most days with no sun there is wind.A demonstration project at the Massachusetts Maritime Academy's shows the effect. A combined power plant linking solar, wind, bio-gas and hydrostorage is proposed as a way to provide 100% renewable power. The 2006 Energy in Scotland Inquiry report expressed concern that wind power cannot be a sole source of supply, and recommends diverse sources of electric energy.

A report from Denmark noted that their wind power network was without power for 54 days during 2002.

Wind power advocates argue that these periods of low wind can be dealt with by simply re starting existing power stations that have been held in readiness. The cost of keeping a power station idle is in fact quite low, since the main cost of running a power station is the fuel.

Penetration

Wind energy "penetration" refers to the fraction of energy produced by wind compared with the total available generation capacity. There is no generally accepted "maximum" level of wind penetration. The limit for a particular grid will depend on the existing generating plants, pricing mechanisms, capacity for storage or demand management, and other factors. An interconnected electricity grid will already include reserve generating and transmission capacity to allow for equipment failures; this reserve capacity can also serve to regulate for the varying power generation by wind plants. Studies have indicated that 20% of the total electrical energy consumption may be incorporated with minimal difficulty. These studies have been for locations with geographically dispersed wind farms, some degree of dispatchable energy, or hydropower with storage capacity, demand management, and interconnection to a large grid area export of electricity when needed. Beyond this level, there are few technical limits, but the economic implications become more significant.

At present, few grid systems have penetration of wind energy above 5%: Denmark (values over 18%), Spain and Portugal (values over 9%), Germany and the Republic of Ireland (values over 6%). The Danish grid is heavily interconnected to the European electrical grid, and it has solved grid management problems by exporting almost half of its wind power to Norway. The correlation between electricity export and wind power production is very strong.

A study commissioned by the state of Minnesota considered penetration of up to 25%, and concluded that integration issues would be manageable and have incremental costs of less than one-half cent ($0.0045) per kWh.

But ESB National Grid, Ireland's electric utility, determined in a 2004 study that, "The adverse effect of wind on thermal plant increases as the wind energy penetration rises. Plant operates less efficiently and with increasing volatility." And they concluded that to meet the renewable energy targets set by the EU in 2001 would "increase electricity generation costs by 15%"

Predictability

Related to variability is the short-term (hourly or daily) predictability of wind plant output. Like other electricity sources, wind energy must be "scheduled". The nature of this energy source makes it inherently variable. Wind power forecasting methods are used, but predictability of wind plant output remains low for short-term operation.

Turbine placement

Main article: Wind farm

Good selection of a wind turbine site is critical to economic development of wind power. Aside from the availability of wind itself, other significant factors include the availability of transmission lines, value of energy to be produced, cost of land acquisition, land use considerations, and environmental impact of construction and operations. Off-shore locations may offset their higher construction cost with higher annual load factors, thereby reducing cost of energy produced. Wind farm designers use specialized wind energy software applications to evaluate the impact of these issues on a given wind farm design.

Utilization of wind power

Further information: Category:Wind power by country

Also see Installed wind power capacity for prior years

Installed windpower capacity (MW)]
Rank Nation 2005 2006 2007
1 Germany 18,415 20,622 22,247
2 United States 9,149 11,603 16,818
3 Spain 10,028 11,615 15,145
4 India 4,430 6,270 8,000
5 China 1,260 2,604 6,050


Nuclear power is any nuclear technology designed to extract usable energy from atomic nuclei via controlled nuclear reactions. The most common method today is through nuclear fission, though other methods include nuclear fusion and radioactive decay. All utility-scale reactors [1] heat water to produce steam, which is then converted into mechanical work for the purpose of generating electricity or propulsion. Today, more than 15% of the world's electricity comes from nuclear power, more than 150 nuclear-powered naval vessels have been built, and a few radioisotope rockets have been produced.
 
The Ikata Nuclear Power Plant, in Japan a pressurized water reactor that has no cooling tower, but cools by direct exchange with the ocean.


The Susquehanna Steam Electric Station in Pennsylvania,  a boiling water reactor. The nuclear reactors are located inside the rectangular containment buildings towards the front of the cooling towers. The towers in the background vent water vapor.


Use

Historical and projected world energy use by energy source, 1980-2030, Source: International Energy Outlook 2007, EIA.
See also: Nuclear power by country and List of nuclear reactors

As of 2005, nuclear power provided 6.3% of the world's energy and 15% of the world's electricity, with the U.S., France, and Japan together accounting for 56.5% of nuclear generated electricity. As of 2007, the IAEA reported there are 439 nuclear power reactors in operation in the world, operating in 31 countries.

The United States produces the most nuclear energy, with nuclear power providing 19% of the electricity it consumes, while France produces the highest percentage of its electrical energy from nuclear reactors—78% as of 2006. In the European Union as a whole, nuclear energy provides 30% of the electricity. Nuclear energy policy differs between European Union countries, and some, such as Austria and Ireland, have no active nuclear power stations. In comparison, France has a large number of these plants, with 16 multi-unit stations in current use.

Many military and some civilian (such as some icebreaker) ships use nuclear marine propulsion, a form of nuclear propulsion. A few space vehicles have been launched using full-fledged nuclear reactors: the Soviet RORSAT series and the American SNAP-10A.

International research is continuing into safety improvements such as passively safe plants,[9] the use of nuclear fusion, and additional uses of process heat such as hydrogen production (in support of a hydrogen economy), for desalinating sea water, and for use in district heating systems.

History

Origins

Nuclear fission was first experimentally achieved by Enrico Fermi in 1934 when his team bombarded uranium with neutrons. In 1938, German chemists Otto Hahn and Fritz Strassmann, along with Austrian physicists Lise Meitner and Meitner's nephew, Otto Robert Frisch, conducted experiments with the products of neutron-bombarded uranium. They determined that the relatively tiny neutron split the nucleus of the massive uranium atoms into two roughly equal pieces, which was a surprising result. Numerous scientists, including Leo Szilard who was one of the first, recognized that if fission reactions released additional neutrons, a self-sustaining nuclear chain reaction could result. This spurred scientists in many countries (including the United States, the United Kingdom, France, Germany, and the Soviet Union) to petition their government for support of nuclear fission research.

In the United States, where Fermi and Szilard had both emigrated, this led to the creation of the first man-made reactor, known as Chicago Pile-1, which achieved criticality on December 2, 1942. This work became part of the Manhattan Project, which built large reactors at the Hanford Site (formerly the town of Hanford, Washington) to breed plutonium for use in the first nuclear weapons. A parallel uranium enrichment effort also was pursued.

After World War II, the fear that reactor research would encourage the rapid spread of nuclear weapons and technology, combined with what many scientists thought would be a long road of development, created a situation in which reactor research was kept under strict government control and classification. In addition, most reactor research centered on purely military purposes.

Electricity was generated for the first time by a nuclear reactor on December 20, 1951 at the EBR-I experimental station near Arco, Idaho, which initially produced about 100 kW (the Arco Reactor was also the first to experience partial meltdown, in 1955). In 1952, a report by the Paley Commission (The President's Materials Policy Commission) for President Harry Truman made a "relatively pessimistic" assessment of nuclear power, and called for "aggressive research in the whole field of solar energy." A December 1953 speech by President Dwight Eisenhower, "Atoms for Peace," emphasized the useful harnessing of the atom and set the U.S. on a course of strong government support for international use of nuclear power.

Early years

In 1954, Lewis Strauss, then chairman of the United States Atomic Energy Commission (forerunner of the U.S. Nuclear Regulatory Commission and the United States Department of Energy) spoke of electricity in the future being "too cheap to meter." While few doubt he was thinking of atomic energy when he made the statement, he may have been referring to hydrogen fusion, rather than uranium fission.[Actually, the consensus of government and business at the time was that nuclear (fission) power might eventually become merely economically competitive with conventional power sources.

On June 27, 1954, the USSRs Obninsk Nuclear Power Plant became the world's first nuclear power plant to generate electricity for a power grid, and produced around 5 megawatts electric power.

In 1955 the United Nations' "First Geneva Conference", then the world's largest gathering of scientists and engineers, met to explore the technology. In 1957 EURATOM was launched alongside the European Economic Community (the latter is now the European Union). The same year also saw the launch of the International Atomic Energy Agency (IAEA).

The world's first commercial nuclear power station, Calder Hall in Sellafield, England was opened in 1956 with an initial capacity of 50 MW (later 200 MW). The first commercial nuclear generator to become operational in the United States was the Shippingport Reactor (Pennsylvania, December, 1957).

One of the first organizations to develop nuclear power was the U.S. Navy, for the purpose of propelling submarines and aircraft carriers. It has a good record in nuclear safety, perhaps because of the stringent demands of Admiral Hyman G. Rickover, who was the driving force behind nuclear marine propulsion as well as the Shippingport Reactor. The U.S. Navy has operated more nuclear reactors than any other entity, including the Soviet Navy,[citation needed][dubious ] with no publicly known major incidents. The first nuclear-powered submarine, USS Nautilus (SSN-571), was put to sea in December 1954. Two U.S. nuclear submarines, USS Scorpion and USS Thresher, have been lost at sea. These vessels were both lost due to malfunctions in systems not related to the reactor plants. Also, the sites are monitored and no known leakage has occurred from the onboard reactors.

Enrico Fermi and Leó Szilárd in 1955 shared U.S. Patent 2,708,656  for the nuclear reactor, belatedly granted for the work they had done during the Manhattan Project.

Development

Installed nuclear capacity initially rose relatively quickly, rising from less than 1 gigawatt (GW) in 1960 to 100 GW in the late 1970s, and 300 GW in the late 1980s. Since the late 1980s worldwide capacity has risen much more slowly, reaching 366 GW in 2005. Between around 1970 and 1990, more than 50 GW of capacity was under construction (peaking at over 150 GW in the late 70s and early 80s) — in 2005, around 25 GW of new capacity was planned. More than two-thirds of all nuclear plants ordered after January 1970 were eventually cancelled.

During the 1970s and 1980s rising economic costs (related to extended construction times largely due to regulatory changes and pressure-group litigation) and falling fossil fuel prices made nuclear power plants then under construction less attractive. In the 1980s (U.S.) and 1990s (Europe), flat load growth and electricity liberalization also made the addition of large new baseload capacity unattractive.

The 1973 oil crisis had a significant effect on countries, such as France and Japan, which had relied more heavily on oil for electric generation (39% and 73% respectively) to invest in nuclear power. Today, nuclear power supplies about 80% and 30% of the electricity in those countries, respectively.

A general movement against nuclear power arose during the last third of the 20th century, based on the fear of a possible nuclear accident, fears of radiation, nuclear proliferation, and on the opposition to nuclear waste production, transport and final storage. Perceived risks on the citizens' health and safety, the 1979 accident at Three Mile Island and the 1986 Chernobyl disaster played a part in stopping new plant construction in many countries, although the public policy organization Brookings Institution suggests that new nuclear units have not been ordered in the U.S. because the Institution's research concludes they cost 15–30% more over their lifetime than conventional coal and natural gas fired plants.

Unlike the Three Mile Island accident, the much more serious Chernobyl accident did not increase regulations affecting Western reactors since the Chernobyl reactors were of the problematic RBMK design only used in the Soviet Union, for example lacking "robust" containment buildings. Many of these reactors are still in use today. However, changes were made in both the reactors themselves (use of low enriched uranium) and in the control system (prevention of disabling safety systems) to prevent the possibility of a duplicate accident.

An international organization to promote safety awareness and professional development on operators in nuclear facilities was created: WANO; World Association of Nuclear Operators.

Opposition in Ireland, New Zealand and Poland prevented nuclear programs there, while Austria (1978), Sweden (1980) and Italy (1987) (influenced by Chernobyl) voted in referendums to oppose or phase out nuclear power.

Future of the industry

See also: Nuclear energy policy, Mitigation of global warming, and Economics of new nuclear power plants

As of 2007, Watts Bar 1, which came on-line in 7 February 1996, was the last U.S. commercial nuclear reactor to go on-line. This is often quoted as evidence of a successful worldwide campaign for nuclear power phase-out. However, political resistance to nuclear power has only ever been successful in New Zealand, and parts of Europe and the Philippines. Even in the U.S. and throughout Europe, investment in research and in the nuclear fuel cycle has continued, and some experts predict that electricity shortages, fossil fuel price increases, global warming and heavy metal emissions from fossil fuel use, new technology such as passively safe plants, and national energy security will renew the demand for nuclear power plants.

Many countries remain active in developing nuclear power, including Japan, China and India, all actively developing both fast and thermal technology, South Korea and the United States, developing thermal technology only, and South Africa and China, developing versions of the Pebble Bed Modular Reactor (PBMR). Several EU member states actively pursue nuclear programs, while some other member states continue to have a ban for the nuclear energy use. Japan has an active nuclear construction program with new units brought on-line in 2005. In the U.S., three consortia responded in 2004 to the U.S. Department of Energy's solicitation under the Nuclear Power 2010 Program and were awarded matching funds—the Energy Policy Act of 2005 authorized loan guarantees for up to six new reactors, and authorized the Department of Energy to build a reactor based on the Generation IV Very-High-Temperature Reactor concept to produce both electricity and hydrogen. As of the early 21st century, nuclear power is of particular interest to both China and India to serve their rapidly growing economies—both are developing fast breeder reactors. See also energy development. In the energy policy of the United Kingdom it is recognized that there is a likely future energy supply shortfall, which may have to be filled by either new nuclear plant construction or maintaining existing plants beyond their programmed lifetime.

There is a possible impediment to production of nuclear power plants, due to a backlog at Japan Steel Works, the only factory in the world able to manufacture the central part of a nuclear reactor's containment vessel in a single piece, which reduces the risk of a radiation leak. The company can only make four per year of the steel forgings. It will double its capacity in the next two years, but still will not be able to meet current global demand alone. Utilities across the world are submitting orders years in advance of any actual need. Other manufacturers are examining various options, including making the component themselves, or finding ways to make a similar item using alternate methods. Other solutions include using designs that do not require single piece forged pressure vessles such as Canada's Advanced CANDU Reactors or Sodium-cooled Fast Reactors.

Other companies able to make the large forgings required for reactor pressure vessels include: Russia's OMZ, which is upgrading to be able to manufacture three or four pressure vessels per year; South Korea's Doosan Heavy Industries; and Mitsubishi Heavy Industries, which is doubling capacity for reactor pressure vessels and other large nuclear components. The UK's Sheffield Forgemasters is evaluating the benefit of tooling-up for nuclear forging work.

A 2007 status report from the anti-nuclear European Greens claimed that, "even if Finland and France build a European Pressurized water Reactor (EPR), China started an additional 20 plants and Japan, Korea or Eastern Europe added one or the other plant, the overall global trend for nuclear power capacity will most likely be downwards over the next two or three decades. With extremely long lead times of 10 years and more [for plant construction], it is practically impossible to maintain or even increase the number of operating nuclear power plants over the next 20 years, unless operating lifetimes would be substantially increased beyond 40 years on average." In fact, China plans to build more than 100 plants, while in the US the licenses of almost half its reactors have already been extended to 60 years, and plans to build more than 30 new ones are under consideration.

Nuclear reactor technology

Conventional thermal power plants all have a fuel source to provide heat. Examples are gas, coal, or oil. For a nuclear power plant, this heat is provided by nuclear fission inside the nuclear reactor. When a relatively large fissile atomic nucleus is struck by a neutron it forms two or more smaller nuclei as fission products, releasing energy and neutrons in a process called nuclear fission. The neutrons then trigger further fission, and so on. When this nuclear chain reaction is controlled, the energy released can be used to heat water, produce steam and drive a turbine that generates electricity. While a nuclear power plant uses the same fuel, uranium-235 or plutonium-239, a nuclear explosive involves an uncontrolled chain reaction, and the rate of fission in a reactor is not capable of reaching sufficient levels to trigger a nuclear explosion because commercial reactor grade nuclear fuel is not enriched to a high enough level. Naturally found uranium contains 0.711% U-235 by mass, the rest being U-238 and trace amounts of other isotopes. Most reactor fuel is enriched to only 3–4%, but some designs use natural uranium or highly enriched uranium. Reactors for nuclear submarines and large naval surface ships, such as aircraft carriers, commonly use highly enriched uranium. Although highly enriched uranium is more expensive, it reduces the frequency of refueling, which is very useful for military vessels. CANDU reactors are able to use unenriched uranium because the heavy water they use as a moderator and coolant does not absorb neutrons like light water does.

The chain reaction is controlled through the use of materials that absorb and moderate neutrons. In uranium-fueled reactors, neutrons must be moderated (slowed down) because slow neutrons are more likely to cause fission when colliding with a uranium-235 nucleus. Light water reactors use ordinary water to moderate and cool the reactors. When at operating temperatures if the temperature of the water increases, its density drops, and fewer neutrons passing through it are slowed enough to trigger further reactions. That negative feedback stabilizes the reaction rate.

The current types of plants (and their common components) are discussed in the article nuclear reactor technology.

A number of other designs for nuclear power generation, the Generation IV reactors, are the subject of active research and may be used for practical power generation in the future. A number of the advanced nuclear reactor designs could also make critical fission reactors much cleaner, much safer and/or much less of a risk to the proliferation of nuclear weapons.

It should be noted that such Generation IV reactors are not necessarily fuel by uranium but by thorium, a more abundant fertile material that decays into U233 after being exposed to neutrons. Such reactors use about 1/300 the amount of fuel to power them. The Liquid Fluoride Reactor is one such example of this.

For the future, design changes are being pursued to lessen the risks of fission reactors; in particular, passively safe plants (such as the ESBWR) are available to be built and inherently safe designs are being pursued. Fusion reactors, which may be viable in the future, have no risk of explosive radiation-releasing accidents, and even smaller risks than the already extremely small risks associated with nuclear fission. Whilst fusion power reactors will produce a very small amount of reasonably short lived, intermediate-level radioactive waste at decommissioning time, as a result of neutron activation of the reactor vessel, they will not produce any high-level, long-lived materials comparable to those produced in a fission reactor. Even this small radioactive waste aspect can be mitigated through the use of low-activation steel alloys for the tokamak vessel.

Life cycle

The Nuclear Fuel Cycle begins when uranium is mined, enriched, and manufactured into nuclear fuel, (1) which is delivered to a nuclear power plant. After usage in the power plant, the spent fuel is delivered to a reprocessing plant  or to a final repository  for geological disposition. In reprocessing 95% of spent fuel can be recycled to be returned to usage in a power plant. Main article: Nuclear fuel cycle

A nuclear reactor is only part of the life-cycle for nuclear power. The process starts with mining (see Uranium mining). Uranium mines are underground, open-pit, or in-situ leach mines. In any case, the uranium ore is extracted, usually converted into a stable and compact form such as yellowcake, and then transported to a processing facility. Here, the yellowcake is converted to uranium hexafluoride, which is then enriched using various techniques. At this point, the enriched uranium, containing more than the natural 0.7% U-235, is used to make rods of the proper composition and geometry for the particular reactor that the fuel is destined for. The fuel rods will spend about 3 operational cycles (typically 6 years total now) inside the reactor, generally until about 3% of their uranium has been fissioned, then they will be moved to a spent fuel pool where the short lived isotopes generated by fission can decay away. After about 5 years in a cooling pond, the spent fuel is radioactively and thermally cool enough to handle, and it can be moved to dry storage casks or reprocessed.

Conventional fuel resources

Uranium is a fairly common element in the Earth's crust. Uranium is approximately as common as tin or germanium in Earth's crust, and is about 35 times more common than silver. Uranium is a constituent of most rocks, dirt, and of the oceans. The world's present measured resources of uranium, economically recoverable at a price of 130 USD/kg, are enough to last for "at least a century" at current consumption rates. This represents a higher level of assured resources than is normal for most minerals. On the basis of analogies with other metallic minerals, a doubling of price from present levels could be expected to create about a tenfold increase in measured resources, over time. The fuel's contribution to the overall cost of the electricity produced is relatively small, so even a large fuel price escalation will have relatively little effect on final price. For instance, typically a doubling of the uranium market price would increase the fuel cost for a light water reactor by 26% and the electricity cost about 7%, whereas doubling the price of natural gas would typically add 70% to the price of electricity from that source. At high enough prices, eventually extraction from sources such as granite and seawater become economically feasible.

Current light water reactors make relatively inefficient use of nuclear fuel, fissioning only the very rare uranium-235 isotope. Nuclear reprocessing can make this waste reusable and more efficient reactor designs allow better use of the available resources.

Breeding

Main article: Breeder reactor

As opposed to current light water reactors which use uranium-235 (0.7% of all natural uranium), fast breeder reactors use uranium-238 (99.3% of all natural uranium). It has been estimated that there is up to five billion years’ worth of uranium-238 for use in these power plants.

Breeder technology has been used in several reactors, but the high cost of reprocessing fuel safely requires uranium prices of more than 200 USD/kg before becoming justified economically. As of December 2005, the only breeder reactor producing power is BN-600 in Beloyarsk, Russia. The electricity output of BN-600 is 600 MW — Russia has planned to build another unit, BN-800, at Beloyarsk nuclear power plant. Also, Japan's Monju reactor is planned for restart (having been shut down since 1995), and both China and India intend to build breeder reactors.

Another alternative would be to use uranium-233 bred from thorium as fission fuel in the thorium fuel cycle. Thorium is about 3.5 times as common as uranium in the Earth's crust, and has different geographic characteristics. This would extend the total practical fissionable resource base by 450%. Unlike the breeding of U-238 into plutonium, fast breeder reactors are not necessary — it can be performed satisfactorily in more conventional plants. India has looked into this technology, as it has abundant thorium reserves but little uranium.

Fusion

Fusion power commonly propose the use of deuterium, an isotope of hydrogen, as fuel and in many current designs also lithium. Assuming a fusion energy output equal to the current global output and that this does not increase in the future, then the known current lithium reserves would last 3000 years, lithium from sea water would last 60 million years, and a more complicated fusion process using only deuterium from sea water would have fuel for 150 billion years.

Water

See also: Water#Industrial_applications and Environmental effects of nuclear power

Like all forms of power generation using steam turbines, Nuclear power plants use large amounts of water for cooling. At Sellafield, which is no longer producing electricity, a maximum of 18,184.4 m³ a day (over 4 million gallons) and 6,637,306 m³ a year (figures from the Environment Agency) of fresh water from Wast Water is still abstracted to use on site for various processes. As with most power plants, two-thirds of the energy produced by a nuclear power plant goes into waste heat (see Carnot cycle), and that heat is carried away from the plant in the water (which remains uncontaminated by radioactivity). The emitted water either is sent into cooling towers where it goes up and is emitted as water droplets (literally a cloud) or is discharged into large bodies of water — cooling ponds, lakes, rivers, or oceans. Droughts can pose a severe problem by causing the source of cooling water to run out.

The Palo Verde Nuclear Generating Station near Phoenix, AZ is the only nuclear generating facility in the world that is not located adjacent to a large body of water. Instead, it uses treated sewage from several nearby municipalities to meet its cooling water needs, recycling 20 billion US gallons (76,000,000 m³) of wastewater each year.

Like conventional power plants, nuclear power plants generate large quantities of waste heat which is expelled in the condenser, following the turbine. Colocation of plants that can take advantage of this thermal energy has been suggested by Oak Ridge National Laboratory (ORNL) as a way to take advantage of process synergy for added energy efficiency. One example would be to use the power plant steam to produce hydrogen from water. The hydrogen would cost less, and the nuclear power plant would exhaust less heat into the atmosphere and water vapor, which is a short-lived greenhouse gas.

Solid waste

For more details on this topic, see Radioactive waste.

The safe storage and disposal of nuclear waste is a significant challenge. The most important waste stream from nuclear power plants is spent fuel. A large nuclear reactor produces 3 cubic metres (25–30 tonnes) of spent fuel each year. It is primarily composed of unconverted uranium as well as significant quantities of transuranic actinides (plutonium and curium, mostly). In addition, about 3% of it is made of fission products. The actinides (uranium, plutonium, and curium) are responsible for the bulk of the long term radioactivity, whereas the fission products are responsible for the bulk of the short term radioactivity.

High level radioactive waste

Spent fuel is highly radioactive and needs to be handled with great care and forethought. However, spent nuclear fuel becomes less radioactive over time. After 40 years, the radiation flux is 99.9% lower than it was the moment the spent fuel was removed, although still dangerously radioactive.

Spent fuel rods are stored in shielded basins of water (spent fuel pools), usually located on-site. The water provides both cooling for the still-decaying fission products, and shielding from the continuing radioactivity. After a few decades some on-site storage involves moving the now cooler, less radioactive fuel to a dry-storage facility or dry cask storage, where the fuel is stored in steel and concrete containers until its radioactivity decreases naturally ("decays") to levels safe enough for other processing. This interim stage spans years or decades, depending on the type of fuel. Most U.S. waste is currently stored in temporary storage sites requiring oversight, while suitable permanent disposal methods are discussed.

As of 2007, the United States had accumulated more than 50,000 metric tons of spent nuclear fuel from nuclear reactors. Underground storage at Yucca Mountain in U.S. has been proposed as permanent storage. After 10,000 years of radioactive decay, according to United States Environmental Protection Agency standards, the spent nuclear fuel will no longer pose a threat to public health and safety.

The amount of waste can be reduced in several ways, particularly reprocessing. Even so, the remaining waste will be substantially radioactive for at least 300 years even if the actinides are removed, and for up to thousands of years if the actinides are left in.[citation needed] Even with separation of all actinides, and using fast breeder reactors to destroy by transmutation some of the longer-lived non-actinides as well, the waste must be segregated from the environment for one to a few hundred years, and therefore this is properly categorized as a long-term problem. Subcritical reactors or fusion reactors could also reduce the time the waste has to be stored. It has been argued that the best solution for the nuclear waste is above ground temporary storage since technology is rapidly changing. The current waste may well become a valuable resource in the future.

France is one of the world's most densely populated countries. According to a 2007 story broadcast on 60 Minutes, nuclear power gives France the cleanest air of any industrialized country, and the cheapest electricity in all of Europe. France reprocesses its nuclear waste to reduce its mass and make more energy. However, the article continues, "Today we stock containers of waste because currently scientists don't know how to reduce or eliminate the toxicity, but maybe in 100 years perhaps scientists will ... Nuclear waste is an enormously difficult political problem which to date no country has solved. It is, in a sense, the Achilles heel of the nuclear industry ... If France is unable to solve this issue, says Mandil, then 'I do not see how we can continue our nuclear program.'" Further, reprocessing itself has its critics, such as the Union of Concerned Scientists.

Low-level radioactive waste

The nuclear industry also produces a volume of low-level radioactive waste in the form of contaminated items like clothing, hand tools, water purifier resins, and (upon decommissioning) the materials of which the reactor itself is built. In the United States, the Nuclear Regulatory Commission has repeatedly attempted to allow low-level materials to be handled as normal waste: landfilled, recycled into consumer items, et cetera. Most low-level waste releases very low levels of radioactivity and is only considered radioactive waste because of its history. For example, according to the standards of the NRC, the radiation released by coffee is enough to treat it as low level waste.

Comparing radioactive waste to industrial toxic waste

In countries with nuclear power, radioactive wastes comprise less than 1% of total industrial toxic wastes, which remain hazardous indefinitely unless they decompose or are treated so that they are less toxic or, ideally, completely non-toxic. Overall, nuclear power produces far less waste material than fossil-fuel based power plants. Coal-burning plants are particularly noted for producing large amounts of toxic and mildly radioactive ash due to concentrating naturally occurring metals and radioactive material from the coal. Contrary to popular belief, coal power actually results in more radioactive waste being released into the environment than nuclear power. The population effective dose equivalent from radiation from coal plants is 100 times as much as nuclear plants.

Reprocessing

For more details on this topic, see Nuclear reprocessing.

Reprocessing can potentially recover up to 95% of the remaining uranium and plutonium in spent nuclear fuel, putting it into new mixed oxide fuel. This would produce a reduction in long term radioactivity within the remaining waste, since this is largely short-lived fission products, and reduces its volume by over 90%. Reprocessing of civilian fuel from power reactors is currently done on large scale in Britain, France and (formerly) Russia, will be in China and perhaps India, and is being done on an expanding scale in Japan. The full potential of reprocessing has not been achieved because it requires breeder reactors, which are not yet commercially available. France is generally cited as the most successful reprocessor, but it presently only recycles 28% (by mass) of the yearly fuel use, 7% within France and another 21% in Russia.

Unlike other countries, the US has stopped civilian reprocessing as one part of US non-proliferation policy, since reprocessed material such as plutonium can be used in nuclear weapons. Spent fuel is all currently treated as waste. In February, 2006, a new U.S. initiative, the Global Nuclear Energy Partnership was announced. It would be an international effort to reprocess fuel in a manner making nuclear proliferation unfeasible, while making nuclear power available to developing countries.

Depleted uranium

Main article: Depleted uranium

Uranium enrichment produces many tons of depleted uranium (DU) which consists of U-238 with most of the easily fissile U-235 isotope removed. U-238 is a tough metal with several commercial uses — for example, aircraft production, radiation shielding, and armor — as it has a higher density than lead. Depleted uranium is also useful in munitions as DU penetrators (bullets or APFSDS tips) 'self sharpen', due to uranium's tendency to fracture along adiabatic shear bands.

There are concerns that U-238 may lead to health problems in groups exposed to this material excessively, like tank crews and civilians living in areas where large quantities of DU ammunition have been used. In January 2003 the World Health Organization released a report finding that contamination from DU munitions were localized to a few tens of meters from the impact sites and contamination of local vegetation and water was 'extremely low'. The report also states that approximately 70% of ingested DU will leave the body after twenty four hours and 90% after a few days.

Debate on nuclear power

Proponents of nuclear energy argue that nuclear power is a sustainable energy source that reduces carbon emissions and increases energy security by decreasing dependence on foreign oil. Proponents also claim that the risks of storing waste are small and can be further reduced by the technology in the new reactors and the operational safety record is already good when compared to the other major kinds of power plants.

Critics claim that nuclear power is a potentially dangerous and decline energy source, with decreasing proportion of nuclear energy in power production, and dispute whether the risks can be reduced through new technology. Critics also point to the problem of storing radioactive waste, the potential for possibly severe radioactive contamination by accident or sabotage, the possibility of nuclear proliferation and the disadvantages of centralized electrical production.

Arguments of economics and safety are used by both sides of the debate.

Reliability

See also: Intermittent power sources

All sources of electrical power sometimes fail, differing only in why, how often, how much, for how long, and how predictably. Even the most reliable giant power plants are intermittent: they fail unexpectedly, often for long periods.

In 2005, out of all nuclear power plants in the world, the average capacity factor was 86.8%, the number of SCRAMs per 7,000 hours critical was 0.6, and the unplanned capacity loss factor was 1.6%. Capacity factor is the net power produced over the maximum amount possible running at 100% all the time, thus this includes all maintenance/refueling outages as well as unplanned losses. The 7,000 hours is roughly representitive of how long any given reactor will remain critical in a year, meaning that the scram rates translates into a sudden and unplanned shutdown about 0.6 times per year for any given reactor in the world. The unplanned capacity loss factor represents amount of power not produced due to unplanned scrams and postponed restarts.

Economics

This is a controversial subject, since multi-billion dollar investments ride on the choice of an energy source. Which power source (generally coal, natural gas, nuclear or wind) is most cost-effective depends on the assumptions used in a particular study — several are quoted in the main article.

Nuclear plants generally have higher capital costs, but in 1983 their operating cost was half that of coal.

In May 2001, The Economist stated that “Nuclear power, once claimed to be too cheap to meter, is now too costly to matter” — cheap to run but very expensive to build. Since then, it has become even more expensive, but so have other sources of baseload power, especially if the potential cost of carbon emissions is included. In June 2008, The Economist stated that "nuclear reactors are the one proven way to make carbon-dioxide-free electricity in large and reliable quantities that does not depend (as hydroelectric and geothermal energy do) on the luck of the geographical draw."

Environmental effects

The primary environmental impacts of nuclear power include Uranium mining, radioactive effluent emissions, and waste heat. Under normal generating conditions, nuclear power does not produce greenhouse gas emissions (CO2, NO2) directly, but the nuclear fuel cycle produces them indirectly, though at much smaller rates than fossil fuels. Nuclear generation does not directly produce sulfur dioxide, nitrogen oxides, mercury or other pollutants associated with the combustion of fossil fuels.

Other issues include disposal of nuclear waste, with high level waste proposed to go in Deep geological repositories and nuclear decommissioning.

Safety

Main article: Nuclear safety
See also: Nuclear safety in the U.S.

The topic of nuclear safety covers:

  • The research and testing of the possible incidents/events at a nuclear power plant,
  • What equipment and actions are designed to prevent those incidents/events from having serious consequences,
  • The calculation of the probabilities of multiple systems and/or actions failing thus allowing serious consequences,
  • The evaluation of the worst-possible timing and scope of those serious consequences (the worst-possible in extreme cases being a release of radiation),
  • The actions taken to protect the public during a release of radiation,
  • The training and rehearsals performed to ensure readiness in case an incident/event occurs.

Numerous different and usually redundantly duplicated safety features have been designed into (and in some cases backfitted to) nuclear power plants. In the United States, the Nuclear Regulatory Commission (NRC) has the ultimate responsibility for nuclear safety.

Accidents

The International Nuclear Event Scale (INES), developed by the International Atomic Energy Agency (IAEA), is used to communicate the severity of nuclear accidents on a scale of 0 to 7. The two most well-known events are the Three Mile Island accident and the Chernobyl disaster.

The Chernobyl disaster in 1986 at the Chernobyl Nuclear Power Plant in the Ukrainian Soviet Socialist Republic (now Ukraine) was the worst nuclear accident in history and is the only event to receive an INES score of 7. The power excursion and resulting steam explosion and fire spread radioactive contamination across large portions of Europe. The UN report 'CHERNOBYL : THE TRUE SCALE OF THE ACCIDENT' published 2005 concluded that the death toll includes the 50 workers who died of acute radiation syndrome, nine children who died from thyroid cancer, and an estimated 4000 excess cancer deaths in the future. This accident occurred due to both the flawed operation of the reactors and critical design flaws in the Soviet RBMK reactors, such as lack of a containment building. This disaster however has led to some "lessons learned" for Western power plants, large improvements in safety at Soviet-designed nuclear power plants and major improvements to the remaining RBMK reactors.

The 1979 accident at Three Mile Island Unit 2 was the worst civilian nuclear accident outside the Soviet Union (INES score of 5). The reactor experienced a partial core meltdown. However, according to the NRC, the reactor vessel and containment building were not breached and little radiation was released to the environment, with no significant impact on health or the environment. Several studies have found no increase in cancer rates.

Greenpeace has produced a report titled An American Chernobyl: Nuclear “Near Misses” at U.S. Reactors Since 1986 which "reveals that nearly two hundred “near misses” to nuclear meltdowns have occurred in the United States". At almost 450 nuclear plants in the world that risk is greatly magnified, they say. This is not to mention numerous incidents, many supposedly unreported, that have occurred. Another report produced by Greenpeace called Nuclear Reactor Hazards: Ongoing Dangers of Operating Nuclear Technology in the 21st Century claims that risk of a major accident has increased in the past years.

Cases where governments have misinformed or underinformed the public underlies much of the distrust. Incidents such as Brookhaven National Laboratory leaking tritium into community groundwater for up to 12 years and  classified accidents at the Rocky Flats Nuclear Weapons Plant along with the extreme nuclear secrecy of East Bloc governments during the Cold War may create the impression that the health and safety of communities surrounding nuclear facilities is of secondary importance. However such mistrust is often misdirected — while the industrial sites that were built to support the Manhattan Project and the Cold War's nuclear arms race display many cases of significant environmental contamination and other safety concerns, in the United States such facilities are operated and regulated completely separately from commercial nuclear power plants.

Contrasting radioactive accident emissions with industrial emissions

Claims exist that the problems of nuclear waste do not come anywhere close to approaching the problems of fossil fuel waste.  A 2004 article from the BBC states: "The World Health Organization (WHO) says 3 million people are killed worldwide by outdoor air pollution annually from vehicles and industrial emissions, and 1.6 million indoors through using solid fuel." In the U.S. alone, fossil fuel waste kills 20,000 people each year. A coal power plant releases 100 times as much radiation as a nuclear power plant of the same wattage.  It is estimated that during 1982, US coal burning released 155 times as much radioactivity into the atmosphere as the Three Mile Island incident. The World Nuclear Association provides a comparison of deaths due to accidents among different forms of energy production. In their comparison, deaths per TW-yr of electricity produced from 1970 to 1992 are quoted as 885 for hydropower, 342 for coal, 85 for natural gas, and 8 for nuclear.

Health effect on population near nuclear plants and workers

Most human exposure to radiation comes from natural background radiation. Most of the remaining exposure comes from medical procedures. Several large studies in the US, Canada, and Europe have found no evidence of any increase in cancer mortality among people living near nuclear facilities. For example, in 1991, the National Cancer Institute (NCI) of the National Institutes of Health announced that a large-scale study, which evaluated mortality from 16 types of cancer, found no increased incidence of cancer mortality for people living near 62 nuclear installations in the United States. The study showed no increase in the incidence of childhood leukemia mortality in the study of surrounding counties after start-up of the nuclear facilities. The NCI study, the broadest of its kind ever conducted, surveyed 900,000 cancer deaths in counties near nuclear facilities.

Some areas of Britain near industrial facilities, particularly near Sellafield, have displayed elevated childhood leukemia levels, in which children living locally are 10 times more likely to contract the cancer. One study of those near Sellafield has ruled out any contribution from nuclear sources, and the reasons for these increases, or clusters, are unclear. Apart from anything else, the levels of radiation at these sites are orders of magnitude too low to account for the excess incidences reported. One explanation is viruses or other infectious agents being introduced into a local community by the mass movement of migrant workers. Likewise, small studies have found an increased incidence of childhood leukemia near some nuclear power plants has been found in Germany and France. Nonetheless, the results of larger multi-site studies in these countries invalidate the hypothesis of an increased risk of leukemia related to nuclear discharge. The methodology and very small samples in the studies finding an increased incidence has been criticized.

In December of 2007, it was reported that a study showed that German children who lived near nuclear power plants had a higher rate of cancer than those who did not. However, the study also stated that there was no extra radiation near the nuclear power plants, and scientists were puzzled as to what was causing the higher rate of cancer.

Alternative reactor designs

The US Government is leading a plan to develop small "disposable" nuclear reactors for deployment in developing countries. However, there has been considerable debate about the security and nuclear proliferation risks of such a proposal.

Russia announced in 2007 that construction has started on the first of seven ships which each will carry a 70-megawatt nuclear reactor. The ships will provide power to remote coastal towns, or be sold abroad, and 12 countries, including Algeria and Indonesia, have expressed interest. There is considerable debate about the safety of such "floating" nuclear reactors.

The Estonian Maritime Academy has developed a project to construct an underwater nuclear reactor off the Baltic Sea coast. The project, submitted to the Estonian Eesti Energia company, proposes the construction of a 1,000-MWt nuclear power plant on a granite shelf of the Muuga Bay. The Head of the Academy has said that the construction of a nuclear reactor on the seabed is completely safe. However, an underwater nuclear power plant would be more costly than a similar land-based project. Local environmentalists have also expressed doubts about the ecological safety of such a giant undertaking on the sea shelf.

In 2003, New Scientist reported that the US Air Force was contemplating a "nuclear-powered unmanned aircraft", to be airborne for months at a time.

Nuclear proliferation and terrorism concerns

For more details on this topic, see Nuclear proliferation.

Nuclear proliferation is the spread of nuclear weapons and related technology to nations not recognized as "Nuclear Weapon States" by the Nuclear Nonproliferation Treaty. Since the days of the Manhattan Project it has been known that reactors could be used for weapons-development purposes—the first nuclear reactors were developed for exactly this reason—as the operation of a nuclear reactor converts U-238 into plutonium. As a consequence, since the 1950s there have been concerns about the possibility of using reactors as a dual-use technology, whereby apparently peaceful technological development could serve as an approach to nuclear weapons capability.

Vulnerability of plants to attack

In the US, plants are surrounded by a double row of tall fences which are electronically monitored. The plant grounds are patrolled by a sizeable force of armed guards. The NRC's "Design Basis Threat" criteria for plants is a secret, and so what size attacking force the plants are able to protect against is unknown. However, to scram a plant takes less than 5 seconds while unimpeded restart takes hours, severely hampering a terrorist force in a goal to release radioactivity.

Use of waste byproduct as a weapon

An additional concern with nuclear power plants is that if the by-products of nuclear fission—the nuclear waste generated by the plant—were to be unprotected it could be used as a radiological weapon, colloquially known as a "dirty bomb". There have been incidents of nuclear plant workers attempting to sell nuclear materials for this purpose (for example, there was such an incident in Russia in 1999 where plant workers attempted to sell 5 grams of radioactive material on the open market, and an incident in 1993 where Russian workers were caught attempting to sell 4.5 kilograms of enriched uranium.), and there are additional concerns that the transportation of nuclear waste along roadways or railways opens it up for potential theft. The UN has since called upon world leaders to improve security in order to prevent radioactive material falling into the hands of terrorists, and such fears have been used as justifications for centralized, permanent, and secure waste repositories and increased security along transportation routes.

See also

 United States of America

Power station reactors

 NRC Region One (Northeast)

 NRC Region Two (South)

 NRC Region Three (Midwest)

NRC Region Four (West)

Plutonium production reactors

Army Nuclear Power Program

 United States Naval reactors

Research reactors

Civilian Research and Test Reactors Licensed To Operate

Operator Location Reactor Power Operational
Aerotest Operations Inc. San Ramon, California TRIGA Mark I 250 kW  
Armed Forces Radiobiology Research Institute Bethesda, Maryland TRIGA Mark F 1 MW  
Cornell University Ithaca, New York TRIGA Mark II 500 kW  
Dow Chemical Company Midland, Michigan TRIGA Mark I 300 kW  
General Electric Company Sunol, California "Nuclear Test" 100 kW  
Idaho State University Pocatello, Idaho AGN-201 #103 50 W 1967
Kansas State University Manhattan, Kansas TRIGA Mark II 1250 kW 1962
Massachusetts Institute of Technology Cambridge, Massachusetts Tank Type HWR Reflected (MITR-II) 5 MW 1958 -
Missouri University of Science and Technology Rolla, Missouri Pool 200 kW 1961 -
National Institute of Standards and Technology Gaithersburg, Maryland TRIGA Mark I 20 MW  
North Carolina State University Raleigh, North Carolina Pulstar 1 MW 1973 -
Ohio State University Columbus, Ohio Pool (modified Lockheed) [13] 500 kW 1961
Oregon State University Corvallis, Oregon TRIGA Mark II (OSTR) 1.1 MW 1967 -
Penn State University University Park, Pennsylvania TRIGA BNR Reactor 1.1 MW 1955 -
Purdue University West Lafayette, Indiana Lockheed 1 kW 1962
Reed College Portland, OR TRIGA Mark I (RRR) 250 kW 1968 -
Rensselaer Polytechnic Institute Troy, New York Critical Assembly    
Rhode Island Atomic Energy Commission Narragansett, Rhode Island GE Pool 2 MW  
Texas A&M University College Station, TX AGN-201M #106 - TRIGA Mark I (two reactors) 5 W, 1 MW
University of Arizona Tucson, AZ TRIGA Mark I 110 kW 1958
University of California-Berkeley Berkeley, California TRIGA Mark III (Shut Down)    
University of California-Davis Sacramento, California TRIGA Mark II, McClellan Nuclear Radiation Center 2.3 MW August 13, 1998 -
University of California, Irvine Irvine, California TRIGA Mark I 250 kW 1969
University of Florida Gainesville, Florida Argonaut (UFTR) 100 kW 1959 -
University of Maryland, College Park College Park, Maryland TRIGA Mark I 250 kW  
University of Massachusetts Lowell Lowell, Massachusetts Pool 1 MW
University of Michigan Ann Arbor, Michigan Pool, Ford Nuclear Reactor (FNR) 2 MW 1957 - 2003
University of Missouri Columbia, Missouri General Electric tank type UMRR 10 MW 1966 -
University of New Mexico Albuquerque, New Mexico AGN-201M $112    
University of Texas at Austin Austin, Texas TRIGA Mark II 1.1 MW  
University of Utah Salt Lake City, Utah TRIGA Mark I 100 kW  
University of Wisconsin-Madison Madison, Wisconsin TRIGA Mark I    
U.S. Geological Survey Denver, Colorado TRIGA Mark I 1 MW  
U.S. Veterans Administration Omaha, Nebraska TRIGA Mark I 20 kW  
Washington State University Pullman, Washington TRIGA Mark I 1.3 MW March 13, 1961 -
Worcester Polytechnic Institute Worcester, Massachusetts GE 10 kW  

 Research and Test Reactors Under Decommission Orders or License Amendments

(These research and test reactors are authorized to decontaminate and dismantle their facility to prepare for final survey and license termination.)

Research and Test Reactors With Possession-Only Licenses

(These research and test reactors are not authorized to operate the reactor, only to possess the nuclear material on-hand. They are permanently shut down.)

 External links

Of the renewable energy sources that generate electricity, hydropower is the most often used. It accounted for 7 percent of total U.S. electricity generation and 73 percent of generation from renewables in 2005.

It is one of the oldest sources of energy and was used thousands of years ago to turn a paddle wheel for purposes such as grinding grain.  Our nation’s first industrial use of hydropower to generate electricity occurred in 1880, when 16 brush-arc lamps were powered using a water turbine at the Wolverine Chair Factory in Grand Rapids, Michigan. The first U.S. hydroelectric power plant opened on the Fox River near Appleton, Wisconsin, on September 30, 1882. Until that time, coal was the only fuel used to produce electricity. Because the source of hydropower is water, hydroelectric power plants must be located on a water source. Therefore, it wasn’t until the technology to transmit electricity over long distances was developed that hydropower became widely used.

Understanding the water cycle is important to understanding hydropower. In the water cycle -
  • Solar energy heats water on the surface, causing it to evaporate.
     
  • This water vapor condenses into clouds and falls back onto the surface as precipitation.
     
  • The water flows through rivers back into the oceans, where it can evaporate and begin the cycle over again.

    Mechanical energy is derived by directing, harnessing, or channeling moving water. The amount of available energy in moving water is determined by its flow or fall.Swiftly flowing water in a big river, like the Columbia River Image of how a hydropower plant works.
<p>The water flows from behind the dam through penstocks, turns the turbines, and causes the generators to generate electricity.
The electricity is carried to users by a transmission line.
Other water flows from behind the dam over spillways and into the river below.along the border between Oregon and Washington, carries a great deal of energy in its flow. So, too, with water descending rapidly from a very high point, like Niagara Falls in New York. In either instance, the water flows through a pipe, or penstock,then pushes against and turns blades in a turbine to spin a generator to produce electricity. In a run-of-the-river system, the force of the current applies the needed pressure, while in a storage system, water is accumulated in reservoirs created by dams, then released when the demand for electricity is high. Meanwhile, the reservoirs or lakes are used for boating and fishing, and often the rivers beyond the dams provide opportunities for whitewater rafting and kayaking. Hoover Dam, a hydroelectric facility completed in 1936 on the Colorado River between Arizona and Nevada, created Lake Mead, a 110-mile-long national recreational area that offers water sports and fishing in a desert setting.
     

  • Over one-half of the total U.S. hydroelectric capacity for electricity generation is concentrated in three States (Washington, California and Oregon) with approximately 27 percent in Washington, the location of the Nation’s largest hydroelectric facility – the Grand Coulee Dam.
  • It is important to note that only a small percentage of all dams in the United States produce electricity. Most dams were constructed solely to provide irrigation and flood control.
  • Some people regard hydropower as the ideal fuel for electricity generation because, unlike the nonrenewable fuels used to generate electricity, it is almost free, there are no waste products, and hydropower does not pollute the water or the air. However, it is criticized because it does change the environment by affecting natural habitats. For instance, in the Columbia River, salmon must swim upstream to their spawning grounds to reproduce, but the series of dams gets in their way. Different approaches to fixing this problem have been used, including the construction of "fish ladders" which help the salmon "step up" the dam to the spawning grounds upstream.

    FROM: http://www.eia.doe.gov/kids/energyfacts/sources/renewable/water.html

    Hydropower or hydraulic power is power that is derived from the force or energy of moving water, which may be harnessed for useful purposes.

    Prior to the widespread availability of commercial electric power, hydropower was used for irrigation, and operation of various machines, such as watermills, textile machines, and sawmills. A trompe produces compressed air from falling water, which could then be used to power other machinery at a distance from the water.

    History

    Hydropower has been used for hundreds of years. In India, water wheels and watermills were built; in Imperial Rome, water powered mills produced flour from grain, and were also used for sawing timber and stone. The power of a wave of water released from a tank was used for extraction of metal ores in a method known as hushing. Hushing was widely used in Britain in the Medieval and later periods to extract lead and tin ores. It later evolved into hydraulic mining when used during the California gold rush.

    In China and the rest of the Far East, hydraulically operated "pot wheel" pumps raised water into irrigation canals. In the 1830s, at the peak of the canal-building era, hydropower was used to transport barge traffic up and down steep hills using inclined plane railroads. Direct mechanical power transmission required that industries using hydropower had to locate near the waterfall. For example, during the last half of the 19th century, many grist mills were built at Saint Anthony Falls, utilizing the 50 foot (15 metre) drop in the Mississippi River. The mills contributed to the growth of Minneapolis. Hydraulic power networks also existed, using pipes carrying pressurized liquid to transmit mechanical power from a power source, such as a pump, to end users.

    Today the largest use of hydropower is for the creation of hydroelectricity, which allows low cost energy to be used at long distances from the water source.

    Natural manifestations

    In hydrology, hydropower is manifested in the force of the water on the riverbed and banks of a river. It is particularly powerful when the river is in flood. The force of the water results in the removal of sediment and other materials from the riverbed and banks of the river, causing erosion and other alterations.

    Types

    There are several forms of water power:

    • Waterwheels, used for hundreds of years to power mills and machinery
    • Hydroelectricity, usually referring to hydroelectric dams, or run-of-the-river setups (eg hydroelectric-powered watermills).
    • Damless hydro, which captures the kinetic energy in rivers, streams and oceans.
    • Tidal power, which captures energy from the tides in horizontal direction
    • Tidal stream power, which does the same vertically
    • Vortex power, which creates vortices which can then be tapped for energy
    • Wave power, which uses the energy in waves

    Hydroelectric power

    Main article: Hydroelectricity

    Hydroelectric power now supplies about 715,000 MWe or 19% of world electricity (16% in 2003)[citation needed]. Large dams are still being designed. The world's largest is the Three Gorges Dam on the third longest river in the world, the Yangtzi River. Apart from a few countries with an abundance of hydro power, this energy source is normally applied to peak load demand, because it is readily stopped and started. It also provides a high-capacity, low-cost means of energy storage, known as "pumped storage".

    Resources in the United States

    There is a common misconception that economically developed nations have harnessed all of their available hydropower resources. In the United States, according to the US Department of Energy, "previous assessments have focused on potential projects having a capacity of 1 MW and above". This may partly explain the discrepancy. More recently, in 2004, an extensive survey was conducted by the US-DOE which counted sources under 1 MW (mean annual average), and found that only 40% of the total hydropower potential had been developed. A total of 170 GW (mean annual average) remains available for development. Of this, 34% is within the operating envelope of conventional turbines, 50% is within the operating envelope of microhydro technologies (defined as less than 100 kW), and 16% is within the operating envelope of unconventional systems. [1] In 2005, the US generated 1012 kilo-watt hours of electricity. The total undeveloped hydropower resource is equivalent to about one-third of total US electricity generation in 2005. Developed hydropower accounted for 6.4% of total US electricity generated in 2005.

    Hydropower produces essentially no carbon dioxide or other harmful emissions, in contrast to burning fossil fuels, and is not a significant contributor to global warming through CO2.

    Hydroelectric power can be far less expensive than electricity generated from fossil fuels or nuclear energy. Areas with abundant hydroelectric power attract industry. Environmental concerns about the effects of reservoirs may prohibit development of economic hydropower sources.

    The chief advantage of hydroelectric dams is their ability to handle seasonal (as well as daily) high peak loads. When the electricity demands drop, the dam simply stores more water (which provides more flow when it releases). Some electricity generators use water dams to store excess energy (often during the night), by using the electricity to pump water up into a basin. Electricity can be generated when demand increases. In practice the utilization of stored water in river dams is sometimes complicated by demands for irrigation which may occur out of phase with peak electrical demands.

    Not all hydroelectric power requires a dam; a run-of-river project only uses part of the stream flow and is a characteristic of small hydropower projects. A developing technology example is the Gorlov helical turbine.

    Tidal power

    Main article: Tidal power

    Harnessing the tides in a bay or estuary has been achieved in France (since 1966), Canada and Russia, and could be achieved in other areas with a large tidal range. The trapped water turns turbines as it is released through the tidal barrage in either direction. A possible fault is that the system would generate electricity most efficiently in bursts every six hours (once every tide). This limits the applications of tidal energy; tidal power is highly predictable but not able to follow changing electrical demand.

    Tidal stream power

    A relatively new technology, tidal stream generators draw energy from currents in much the same way that wind generators do. The higher density of water means that a single generator can provide significant power. This technology is at the early stages of development and will require more research before it becomes a significant contributor.

    Several prototypes have shown promise. In the UK in 2003, a 300 kW Periodflow marine current propeller type turbine was tested off the coast of Devon, and a 150 kW oscillating hydroplane device, the Stingray, was tested off the Scottish coast. Another British device, the Hydro Venturi, is to be tested in San Francisco Bay.

    The Canadian company Blue Energy has plans for installing very large arrays tidal current devices mounted in what they call a 'tidal fence' in various locations around the world, based on a vertical axis turbine design.

    Wave power

    Main article: Wave power

    Harnessing power from ocean surface wave motion might yield much more energy than tides. The feasibility of this has been investigated, particularly in Scotland in the UK. Generators either coupled to floating devices or turned by air displaced by waves in a hollow concrete structure would produce electricity. Numerous technical problems have frustrated progress.

    A prototype shore based wave power generator is being constructed at Port Kembla in Australia and is expected to generate up to 500 MWh annually. The Wave Energy Converter has been constructed (as of July 2005) and initial results have exceeded expectations of energy production during times of low wave energy. Wave energy is captured by an air driven generator and converted to electricity. For countries with large coastlines and rough sea conditions, the energy of waves offers the possibility of generating electricity in utility volumes. Excess power during rough seas could be used to produce hydrogen.

    Physics

    A hydropower resource can be measured according to the amount of available power, or energy per unit time. In large reservoirs, the available power is generally only a function of the hydraulic head and rate of fluid flow. In a reservoir, the head is the height of water in the reservoir relative to its height after discharge. Each unit of water can do an amount of work equal to its weight times the head.

    The amount of energy \, E released by lowering an object of mass \, m by a height \, h in a gravitational field is

    \, E = mgh where \, g is the acceleration due to gravity.

    The energy available to hydroelectric dams is the energy that can be liberated by lowering water in a controlled way. In these situations, the power is related to the mass flow rate.

    \frac{E}{t} = \frac{m}{t}gh

    Substituting \, P for \frac{E}{t} and expressing \frac{m}{t} in terms of the volume of liquid moved per unit time (the rate of fluid flow \, \phi) and the density of water, we arrive at the usual form of this expression:

    P = \rho\, \phi\, g \, h.

    For \, P in watts, \, \rho is measured in kg/m³, \,\phi is measured in m³/s, \, g (standard gravity) is measured in m/s², and \, h is measured in metres.

    Some hydropower systems such as water wheels can draw power from the flow of a body of water without necessarily changing its height. In this case, the available power is the kinetic energy of the flowing water.

    P = \frac{1}{2}\,\rho\,\phi\, v^2 where \, v is the velocity of the water,

    or with  \phi = A\, v where A is the area through which the water passes, also

    P = \frac{1}{2}\,\rho\, A\, v^3.

    Over-shot water wheels can efficiently capture both types of energy.

    Small scale hydro power

    Small scale hydro or micro-hydro power has been increasingly used as an alternative energy source, especially in remote areas where other power sources are not viable. Small scale hydro power systems can be installed in small rivers or streams with little or no discernible environmental effect on things such as fish migration. Most small scale hydro power systems make no use of a dam or major water diversion, but rather use water wheels.

    There are some considerations in a micro-hydro system installation. The amount of water flow available on a consistent basis, since lack of rain can affect plant operation. Head, or the amount of drop between the intake and the exit. The more head, the more power that can be generated. There can be legal and regulatory issues, since most countries, cities, and states have regulations about water rights and easements.

    Over the last few years, the U.S. Government has increased support for alternative power generation. Many resources such as grants, loans, and tax benefits are available for small scale hydro systems.

    In poor areas, many remote communities have no electricity. Micro hydro power, with a capacity of 100 kW or less, allows communities to generate electricity1. This form of power is supported by various organizations such as the UK's Practical Action.

    Micro-hydro power can be used directly as "shaft power" for many industrial applications. Alternatively, the preferred option for domestic energy supply is to generate electricity with a generator or a reversed electric motor which, while less efficient, is likely to be available locally and cheaply.

    See also

    video - WATER - FREE ENERGY

    video - WATER FUELED CARS


    BIOFUELS

    Biofuel

    From Wikipedia, the free encyclopedia

    Renewable energy
     
     
    Sugar cane can be used as a biofuel or food.
    Sugar cane can be used as a biofuel or fooD.


    Saab 99 running on wood gas. Gas generator on trailer.
    Saab 99 running on wood gas. Gas generator on trailer.

    Biofuel can be broadly defined as solid, liquid, or gas fuel derived from recently dead biological material.This distinguishes it from fossil fuels, which are derived from long dead biological material. Biofuel can be theoretically produced from any (biological) carbon source, though the most common by far is photosynthetic plants. Many different plants and plant-derived materials are used for biofuel manufacture. Biofuels are used globally, most commonly to power vehicles and cooking stoves. Biofuel industries are expanding in Europe, Asia and the Americas.

    Biofuels offer the possibility of producing energy without a net increase of carbon into the atmosphere because the plants used in to produce the fuel have removed CO2 from the atmosphere, unlike fossil fuels which return carbon which was stored beneath the surface for millions of years into the air. Biofuel is therefore more nearly carbon neutral and less likely increase atmospheric concentrations of greenhouse gases (though doubts have been raised as to whether this benefit can be achieved in practice, see below). The use of biofuels also reduces dependence on petroleum and enhances energy security.

    There are two common strategies of producing biofuels. One is to grow crops high in either sugar (sugar cane, sugar beet, and sweet sorghum) or starch (corn/maize), and then use yeast fermentation to produce ethyl alcohol (ethanol). The second is to grow plants that contain high amounts of vegetable oil, such as oil palm, soybean, algae, or jatropha. When these oils are heated, their viscosity is reduced, and they can be burned directly in a diesel engine, or the oils can be chemically processed to produce fuels such as biodiesel. Wood and its byproducts can also be converted into biofuels such as woodgas, methanol or ethanol fuel. It is also possible to make cellulosic ethanol from non-edible plant parts, but this can be difficult to accomplish economically.

    Biofuels are discussed as having significant roles in a variety of international issues, including: mitigation of carbon emissions levels and oil prices, the "food vs fuel" debate, deforestation and soil erosion, impact on water resources, and energy balance and efficiency.

     History and policy

    Humans have used biomass fuels in the form of solid biofuels for heating and cooking since the discovery of fire. Following the discovery of electricity, it became possible to use biofuels to generate electrical power as well. However, the discovery and use of fossil fuels: coal, gas and oil, have dramatically reduced the amount of biomass fuel used in the developed world for transport, heat and power. biofuels-p2.html National Geographic, Green Dreams, Oct 2007]  However, when large supplies of crude oil were discovered in Pennsylvania and Texas, petroleum based fuels became inexpensive, and soon were widely used. Cars and trucks began using fuels derived from mineral oil/petroleum: gasoline/petrol or diesel.

    Nevertheless, before World War II, and during the high demand wartime period, biofuels were valued as a strategic alternative to imported oil. Wartime Germany experienced extreme oil shortages, and many energy innovations resulted. This includes the powering of some of its vehicles using a blend of gasoline with alcohol fermented from potatoes, called Monopolin.[citation needed] In Britain, grain alcohol was blended with petrol by the Distillers Company Limited under the name Discol, and marketed through Esso's affiliate Cleveland.[citation needed]

    During the peacetime post-war period, inexpensive oil from the Middle East contributed in part to the lessened economic and geopolitical interest in biofuels. Then in 1973 and 1979, geopolitical conflict in the Middle East caused OPEC to cut exports, and non-OPEC nations experienced a very large decrease in their oil supply. This "energy crisis" resulted in severe shortages, and a sharp increase in the prices of high demand oil-based products, notably petrol/gasoline. There was also increased interest from governments and academics in energy issues and biofuels. Throughout history, the fluctuations of supply and demand, energy policy, military conflict, and the environmental impacts, have all contributed to a highly complex and volatile market for energy and fuel.

    In the year 2000 and beyond, renewed interest in biofuels has been seen. The drivers for biofuel research and development include rising oil prices, concerns over the potential oil peak, greenhouse gas emissions (causing global warming and climate change), rural development interests, and instability in the Middle East.

    Biomass

    Main article: Biomass

    Biomass is material derived from recently living organisms. This includes plants, animals and their by-products. For example, manure, garden waste and crop residues are all sources of biomass. It is a renewable energy source based on the carbon cycle, unlike other natural resources such as petroleum, coal, and nuclear fuels.

    Animal waste is a persistent and unavoidable pollutant produced primarily by the animals housed in industrial sized farms. Researchers from Washington University have figured out a way to turn manure into biomass. In April 2008 with the help of imaging technology they noticed that vigorous mixing helps microorganisms turn farm waste into alternative energy, providing farmers with a simple way to treat their waste and convert it into energy.

    There are also agricultural products specifically grown for biofuel production include corn, switchgrass, and soybeans, primarily in the United States; rapeseed, wheat and sugar beet primarily in Europe; sugar cane in Brazil; palm oil and miscanthus in South-East Asia; sorghum and cassava in China; and jatropha in India. Hemp has also been proven to work as a biofuel. Biodegradable outputs from industry, agriculture, forestry and households can be used for biofuel production, either using anaerobic digestion to produce biogas, or using second generation biofuels; examples include straw, timber, manure, rice husks, sewage, and food waste. The use of biomass fuels can therefore contribute to waste management as well as fuel security and help to prevent climate change, though alone they are not a comprehensive solution to these problems.

    Bio energy from waste

    Using waste biomass to produce energy can reduce the use of fossil fuels, reduce greenhouse gas emissions and reduce pollution and waste management problems. A recent publication by the European Union highlighted the potential for waste-derived bioenergy to contribute to the reduction of global warming. The report concluded that 19 million tons of oil equivalent is available from biomass by 2020, 46% from bio-wastes: municipal solid waste (MSW), agricultural residues, farm waste and other biodegradable waste streams.

    Landfill sites generate gases as the waste buried in them undergoes anaerobic digestion. These gases are known collectively as landfill gas (LFG). This can be burned and is considered a source of renewable energy, even though landfill disposal are often non-sustainable. Landfill gas can be burned either directly for heat or to generate electricity for public consumption. Landfill gas contains approximately 50% methane, the same gas that is found in natural gas.

    Biomass can come from waste plant material. If landfill gas is not harvested, it escapes into the atmosphere: this is not desirable because methane is a greenhouse gas, with more global warming potential than carbon dioxide. Over a time span of 100 years, methane has a global warming potential of 23 relative to CO2. Therefore, during this time, one ton of methane produces the same greenhouse gas (GHG) effect as 23 tons of CO2.[citation needed] When methane burns the formula is CH4 + 2O2 = CO2 + 2H2O So by harvesting and burning landfill gas, its global warming potential is reduced a factor of 23, in addition to providing energy for heat and power.

    Frank Keppler and Thomas Rockmann discovered that living plants also produce methane CH4. The amount of methane produced by living plants is 10 to 100 times greater than that produced by dead plants (in an aerobic environment) but does not increase global warming because of the carbon cycle.

    Anaerobic digestion can be used as a distinct waste management strategy to reduce the amount of waste sent to landfill and generate methane, or biogas. Any form of biomass can be used in anaerobic digestion and will break down to produce methane, which can be harvested and burned to generate heat, power or to power certain automotive vehicles.

    A 3 MW landfill power plant would power 1,900 homes. It would eliminate 6,000 tons per year of methane from getting into the environment.. It would eliminate 18,000 tons per year of CO2 from fossil fuel replacement.. This is the same as removing 25,000 cars from the road, or planting 36,000 acres (146 km²) of forest, or not using 305,000 barrels (48,500 m³) of oil per year.

    Liquid fuels for transportation

    Most transportation fuels are liquids, because vehicles usually require high energy density, as occurs in liquids and solids. Vehicles usually need high power density as can be provided most inexpensively by an internal combustion engine. These engines require clean burning fuels, in order to keep the engine clean and minimize air pollution. The fuels that are easier to burn cleanly are typically liquids and gases. Thus liquids (and gases that can be stored in liquid form) meet the requirements of being both portable and clean burning. Also, liquids and gases can be pumped, which means handling is easily mechanized, and thus less laborious.

    Types of biofuels

     First generation biofuels

    'First-generation biofuels' refer to biofuels made from sugar, starch, vegetable oil, or animal fats using conventional technology. The basic feedstocks for the production of first generation biofuels are often seeds or grains such as wheat, which yields starch that is fermented into bioethanol, or sunflower seeds, which are pressed to yield vegetable oil that can be used in biodiesel. These feedstocks could also enter the animal or human food chain, and as the global population has risen their use in producing biofuels has been criticised for diverting food away from the human food chain, leading to food shortages and price rises.

    The most common first generation biofuels are listed below.

    Vegetable oil

    Edible vegetable oil is generally not used as fuel, but lower quality oil can be used for this purpose. Used vegetable oil is increasingly being processed into biodiesel, or (less frequently) cleaned of water and particulates and used as a fuel. To ensure that the fuel injectors atomize the fuel in the correct pattern for efficient combustion, vegetable oil fuel must be heated to reduce its viscosity to that of diesel, either by electric coils or heat exchangers. This is easier in warm or temperate climates. MAN B&W Diesel, Wartsila and Deutz AG offer engines that are compatible with straight vegetable oil, without the need for after market modifications. Vegetable oil can also be used in many older diesel engines that do not use common rail or unit injection electronic diesel injection systems. Due to the design of the combustion chambers in indirect injection engines, these are the best engines for use with vegetable oil. This system allows the relatively larger oil molecules more time to burn. However, a number of drivers have successfully experimented with earlier pre- "pumpe duse" VW TDI engines and other similar engines with direct injection.

    Biodiesel

    Biodiesel is the most common biofuel in Europe. It is produced from oils or fats using transesterification and is a liquid similar in composition to fossil/mineral diesel. Its chemical name is fatty acid methyl (or ethyl) ester (FAME). Oils are mixed with sodium hydroxide and methanol (or ethanol) and the chemical reaction produces biodiesel (FAME) and glycerol. One part glycerol is produced for every 10 parts biodiesel. Feedstocks for biodiesel include animal fats, vegetable oils, soy, rapeseed, jatropha, mahua, mustard, flax, sunflower, palm oil, hemp, field pennycress, and algae. Pure biodiesel (B100) is by far the lowest emission diesel fuel. Although liquefied petroleum gas and hydrogen have cleaner combustion, they are used to fuel much less efficient petrol engines and are not as widely available.

    Biodiesel can be used in any diesel engine when mixed with mineral diesel. The majority of vehicle manufacturers limit their recommendations to 15% biodiesel blended with mineral diesel. In some countries manufacturers cover their diesel engines under warranty for B100 use, although Volkswagen of Germany, for example, asks drivers to make a telephone check with the VW environmental services department before switching to B100. B100 may become more viscous at lower temperatures, depending on the feedstock used, requiring vehicles to have fuel line heaters. In most cases biodiesel is compatible with diesel engines from 1994 onwards, which use 'Viton' (by DuPont) synthetic rubber in their mechanical injection systems. Electronically controlled 'common rail' and 'pump duse' type systems from the late 90s onwards (whose finely metered and atomized multi-stage injection systems are very sensitive to the viscosity of the fuel), may only use biodiesel blended with conventional diesel fuel. Many of the current generation of diesel engines are made so that they can run on B100 without altering the engine itself, although this can be dependent on the fuel rail design.

    Since biodiesel is an effective solvent and cleans residues deposited by mineral diesel, engine filters may need to be replaced more often as the biofuel dissolves old deposits in the fuel tank and pipes. It also effectively cleans the engine combustion chamber of carbon deposits, helping to maintain efficiency. In many European countries, a 5% biodiesel blend is widely used and is available at thousands of gas stations. Biodiesel is also an oxygenated fuel, meaning that it contains a reduced amount of carbon and higher hydrogen and oxygen content than fossil diesel. This improves the combustion of fossil diesel and reduces the particulate emissions from un-burnt carbon.

    In the USA, more than 80% of commercial trucks and city buses run on diesel. Therefore there is an emerging U.S. biodiesel market, estimated to have grown 200 percent from 2004 to 2005. "By the end of 2006 biodiesel production was estimated to increase fourfold [from 2004] to more than 1 billion gallons,".

    Bioalcohols

    Main article: Alcohol fuel

    Biologically produced alcohols, most commonly ethanol, and less commonly propanol and butanol, are produced by the action of microorganisms and enzymes through the fermentation of sugars or starches (easiest), or cellulose (which is more difficult). Biobutanol (also called biogasoline) is often claimed to provide a direct replacement for gasoline, because it can be used directly in a gasoline engine (in a similar way to biodiesel in diesel engines).

    Butanol is formed by ABE fermentation (acetone, butanol, ethanol) and experimental modifications of the process show potentially high net energy gains with butanol as the only liquid product. Butanol will produce more energy and allegedly can be burned "straight" in existing gasoline engines (without modification to the engine or car), and is less corrosive and less water soluble than ethanol, and could be distributed via existing infrastructures. DuPont and BP are working together to help develop Butanol.

    Ethanol fuel is the most common biofuel worldwide, particularly in Brazil. Alcohol fuels are produced by fermentation of sugars derived from wheat, corn, sugar beets, sugar cane, molasses and any sugar or starch that alcoholic beverages can be made from (like potato and fruit waste, etc.). The ethanol production methods used are enzyme digestion (to release sugars from stored starches, fermentation of the sugars, distillation and drying. The distillation process requires significant energy input for heat (often unsustainable natural gas fossil fuel, but cellulosic biomass such as bagasse, the waste left after sugar cane is pressed to extract its juice, can also be used more sustainably).

    Ethanol can be used in petrol engines as a replacement for gasoline; it can be mixed with gasoline to any percentage. Most existing automobile petrol engines can run on blends of up to 15% bioethanol with petroleum/gasoline. Gasoline with ethanol added has higher octane, which means that your engine can typically burn hotter and more efficiently. In high altitude (thin air) locations, some states mandate a mix of gasoline and ethanol as a winter oxidizer to reduce atmospheric pollution emissions.

    Ethanol fuel has less BTU energy content, which means it takes more fuel (volume and mass) to go the same distance. More-expensive premium fuels contain less, or no, ethanol. In high-compression engines, less ethanol, slower-burning premium fuel is required to avoid harmful pre-ignition (knocking). Very-expensive aviation gasoline (Avgas) is 100 octane made from 100% petroleum. The high price of zero-ethanol Avgas does not include federal-and-state road-use taxes.

    Ethanol is very corrosive to fuel systems, rubber hoses-and-gaskets, aluminum, and combustion chambers. It is therefore illegal to use fuels containing alcohol in aircraft (although at least one model of ethanol-powered aircraft has been developed, the Embraer EMB 202 Ipanema). Ethanol is incompatible with marine fiberglass fuel tanks (it makes them leak). For higher ethanol percentage blends, and 100% ethanol vehicles, engine modifications are required.

    Corrosive ethanol cannot be transported in petroleum pipelines, so more-expensive over-the-road stainless-steel tank trucks increase the cost and energy consumption required to deliver ethanol to the customer at the pump.

    In the current alcohol-from-corn production model in the United States, considering the total energy consumed by farm equipment, cultivation, planting, fertilizers, pesticides, herbicides, and fungicides made from petroleum, irrigation systems, harvesting, transport of feedstock to processing plants, fermentation, distillation, drying, transport to fuel terminals and retail pumps, and lower ethanol fuel energy content, the net energy content value added and delivered to consumers is very small. And, the net benefit (all things considered) does little to reduce un-sustainable imported oil and fossil fuels required to produce the ethanol.

    Many car manufacturers are now producing flexible-fuel vehicles (FFV's), which can safely run on any combination of bioethanol and petrol, up to 100% bioethanol. They dynamically sense exhaust oxygen content, and adjust the engine's computer systems, spark, and fuel injection accordingly. This adds initial cost and ongoing increased vehicle maintenance. Efficiency falls and pollution emissions increase when FFV system maintenance is needed (regardless of the 0%-to-100% ethanol mix being used), but not performed (as with all vehicles). FFV internal combustion engines are becoming increasingly complex, as are multiple-propulsion-system FFV hybrid vehicles, which impacts cost, maintenance, reliability, and useful lifetime longevity

    Alcohol mixes with both petroleum and with water, so ethanol fuels are often diluted after the drying process by absorbing environmental moisture from the atmosphere. Water in alcohol-mix fuels reduces efficiency, makes engines harder to start, causes intermittent operation (sputtering), and oxidizes aluminum (carburetors) and steel components (rust).

    Even dry ethanol has roughly one-third lower energy content per unit of volume compared to gasoline, so larger / heavier fuel tanks are required to travel the same distance, or more fuel stops are required. With large current un-sustainable, non-scalable subsidies, ethanol fuel still costs much more per unit of distance traveled than current high gasoline prices in the United States.

    Methanol is currently produced from natural gas, a non-renewable fossil fuel. It can also be produced from biomass as biomethanol. The methanol economy is an interesting alternative to the hydrogen economy, compared to today's hydrogen produced from natural gas, but not hydrogen production directly from water and state-of-the-art clean solar thermal energy processes.

    BioGas

    Main article: biogas

    Biogas is produced by the process of anaerobic digestion of organic material by anaerobes. It can be produced either from biodegradable waste materials or by the use of energy crops fed into anaerobic digesters to supplement gas yields. The solid byproduct, digestate, can be used as a biofuel or a fertilizer. In the UK, the National Coal Board experimented with microorganisms that digested coal in situ converting it directly to gases such as methane.

    Biogas contains methane and can be recovered from industrial anaerobic digesters and mechanical biological treatment systems. Landfill gas is a less clean form of biogas which is produced in landfills through naturally occurring anaerobic digestion. If it escapes into the atmosphere it is a potent greenhouse gas.

    Oils and gases can be produced from various biological wastes:

    • Thermal depolymerization of waste can extract methane and other oils similar to petroleum.
    • GreenFuel Technologies Corporation developed a patented bioreactor system that uses nontoxic photosynthetic algae to take in smokestacks flue gases and produce biofuels such as biodiesel, biogas and a dry fuel comparable to coal.

    Solid biofuels

    Examples include wood, grass cuttings, domestic refuse, charcoal, and dried manure.

    Syngas

    Main article: Gasification

    Syngas is produced by the combined processes of pyrolysis, combustion, and gasification. Biofuel is converted into carbon monoxide and energy by pyrolysis. A limited supply of oxygen is introduced to support combustion. Gasification converts further organic material to hydrogen and additional carbon monoxide.

    The resulting gas mixture, syngas, is itself a fuel. Using the syngas is more efficient than direct combustion of the original biofuel; more of the energy contained in the fuel is extracted.

    Syngas may be burned directly in internal combustion engines. The wood gas generator is a wood-fueled gasification reactor mounted on an internal combustion engine. Syngas can be used to produce methanol and hydrogen, or converted via the Fischer-Tropsch process to produce a synthetic petroleum substitute. Gasification normally relies on temperatures >700°C. Lower temperature gasification is desirable when co-producing biochar.

    Second generation biofuels

    Supporters of biofuels claim that a more viable solution is to increase political and industrial support for, and rapidity of, second-generation biofuel implementation from non food crops, including cellulosic biofuels.[18] Second-generation biofuel production processes can use a variety of non food crops. These include waste biomass, the stalks of wheat, corn, wood, and special-energy-or-biomass crops (e.g. Miscanthus). Second generation (2G) biofuels use biomass to liquid technology, including cellulosic biofuels from non food crops.[19] Many second generation biofuels are under development such as biohydrogen, biomethanol, DMF, Bio-DME, Fischer-Tropsch diesel, biohydrogen diesel, mixed alcohols and wood diesel.

    Cellulosic ethanol production uses non food crops or inedible waste products and does not divert food away from the animal or human food chain. Lignocellulose is the "woody" structural material of plants. This feedstock is abundant and diverse, and in some cases (like citrus peels or sawdust) it is a significant disposal problem.

    Producing ethanol from cellulose is a difficult technical problem to solve. In nature, Ruminant livestock (like cattle) eat grass and then use slow enzymatic digestive processes to break it into glucose (sugar). In cellulosic ethanol laboratories, various experimental processes are being developed to do the same thing, and then the sugars released can be fermented to make ethanol fuel.

    Scientists also work on experimental recombinant DNA genetic engineering organisms that could increase biofuel potential.

     Third generation biofuels

    Main article: Algae fuel

    Algae fuel, also called oilgae or third generation biofuel, is a biofuel from algae. Algae are low-input/high-yield (30 times more energy per acre than land) feedstocks to produce biofuels and algae fuel are biodegradable:

    • One advantage of many biofuels over most other fuel types is that they are biodegradable, and so relatively harmless to the environment if spilled.

    Second and third generation biofuels are also called advanced biofuels.

    On the other hand, an appearing fourth generation is based in the conversion of vegoil and biodiesel into gasoline.

    Fourth generation biofuels

    Craig Venter's company Synthetic Genomics is genetically engineering microorganisms to produce fuel directly from carbon dioxide on an industrial scale.

    Biofuels by country

    Recognizing the importance of implementing bioenergy, there are international organizations such as IEA Bioenergy, established in 1978 by the OECD International Energy Agency (IEA), with the aim of improving cooperation and information exchange between countries that have national programs in bioenergy research, development and deployment. The U.N. International Biofuels Forum is formed by Brazil, China, India, South Africa, the United States and the European Commission. The world leaders in biofuel development and use are Brazil, United States, France, Sweden and Germany.

    See also: Biodiesel around the world

    Israel

    IC Green Energy, a subsidiary of Israel Corp., aims by 2012 to process 4-5% of the global biofuel market (~4 million tons). It is focused solely on non-edible feedstock such as Jatropha, Castor, cellulosic biomass and algae. In June 2008, Tel Aviv-based Seambiotic and Seattle-based Inventure Chemical announced a joint venture to use CO2 emissions-fed algae to make ethanol and biodiesel at a biofuel plant in Israel.

    China

    In China, the government is making E10 blends mandatory in five provinces that account for 16% of the nation's passenger cars. In Southeast Asia, Thailand has mandated an ambitious 10% ethanol mix in gasoline starting in 2007. For similar reasons, the palm oil industry plans to supply an increasing portion of national diesel fuel requirements in Malaysia and Indonesia.  In Canada, the government aims for 45% of the country’s gasoline consumption to contain 10% ethanol by 2010.

    India

    Main article: Biofuels in India

    In India, a bioethanol program calls for E5 blends throughout most of the country targeting to raise this requirement to E10 and then E20.

    Europe

    The European Union in its biofuels directive (updated 2006) has set the goal that for 2010 that each member state should achieve at least 5.75% biofuel usage of all used traffic fuel. By 2020 the figure should be 10%. As of January 2008 these aims are being reconsidered in light of certain environmental and social concerns associated with biofuels such as rising food prices and deforestation.

    France

    France is the second largest biofuel consumer among the EU States in 2006. According to the Ministry of Industry, France's consumption increased by 62.7% to reach 682,000 toe (i.e. 1.6% of French fuel consumption). Biodiesel represents the largest share of this (78%, far ahead of bioethanol with 22%). The unquestionable biodiesel leader in Europe is the French company Diester Industrie. In bioethanol, the French agro-industrial group Téréos is increasing its production capacities. Germany itself remained the largest European biofuel consumer, with a consumption estimate of 2.8 million tons of biodiesel (equivalent to 2,408,000 toe), 0.71 million ton of vegetable oil (628.492 toe) and 0.48 million ton of bioethanol (307,200 toe).

     Germany

    The biggest biodiesel German company is ADM Ölmühle Hamburg AG, which is a subsidiary of the American group Archer Daniels Midland Company. Among the other large German producers, MUW (Mitteldeutsche Umesterungswerke GmbH & Co KG) and EOP Biodiesel AG. A major contender in terms of bioethanol production is the German sugar corporation, Südzucker.

    Spain

    The Spanish group Abengoa, via its American subsidiary Abengoa Bioenergy, is the European leader in production of bioethanol.

    Sweden

    Main article: Biofuel in Sweden

    The government in Sweden has together with BIL Sweden, the national association for the automobile industry, that are the automakers in Sweden started the work to end oil dependency. One-fifth of cars in Stockholm can run on alternative fuels, mostly ethanol fuel. Also Stockholm will introduce a fleet of Swedish-made hybrid ethanol-electric buses. In 2005, oil phase-out in Sweden by 2020 was announced.

    United Kingdom

    In the United Kingdom the Renewable Transport Fuel Obligation (RTFO) (announced 2005) is the requirement that by 2010 5% of all road vehicle fuel is renewable. In 2008 a critical report by the Royal Society stated that biofuels risk failing to deliver significant reductions in greenhouse gas emissions from transport and could even be environmentally damaging unless the Government puts the right policies in place.

    Brazil

    Main article: Biofuel in Brazil

    In Brazil, the government hopes to build on the success of the Proálcool ethanol program by expanding the production of biodiesel which must contain 2% biodiesel by 2008, increasing to 5% by 2013.

    Colombia

    Colombia mandates the use of 10% ethanol in all gasoline sold in cities with populations exceeding 500,000. In Venezuela, the state oil company is supporting the construction of 15 sugar cane distilleries over the next five years, as the government introduces a E10 (10% ethanol) blending mandate.

    USA

    In 2006, the United States president George W. Bush said in a State of the Union speech that the US is "addicted to oil" and should replace 75% of imported oil by 2025 by alternative sources of energy including biofuels.

    Essentially all of the ethanol fuel in the US is produced from corn. Corn is a very energy intensive crop, which requires one unit of fossil-fuel energy to create just 0.9 to 1.3 energy units of ethanol.[36] A senior member of the House Energy and Commerce Committee Congressman Fred Upton has introduced legislation to use at least E10 fuel by 2012 in all cars in the USA.

    The 2007-12-19 U.S. Energy Independence and Security Act of 2007 requires American “fuel producers to use at least 36 billion gallons of biofuel in 2022. This is nearly a fivefold increase over current levels.”[37] This is causing a significant agricultural resource shift away from food production to biofuels. American food exports have decreased (increasing grain prices worldwide), and US food imports have increased significantly.

    Most biofuels are not currently cost-effective without significant subsidies. "America's ethanol program is a product of government subsidies. There are more than 200 different kinds, as well as a 54 cents-a-gallon tariff on imported ethanol. This prices Brazilian ethanol out of an otherwise competitive market. Brazil makes ethanol from sugarcane rather than corn (maize), which has a better EROEI. Federal subsidies alone cost $7 billion a year (equal to around $1.90 a gallon)."

    General Motors is starting a project to produce E85 fuel from cellulose ethanol for a projected cost of $1 a gallon. This is optimistic however, because $1/gal equates to $10/MBTU which is comparable to woodchips at $7/MBTU or cord wood at $6-$12/MBTU, and this does not account for conversion losses and plant operating and capital costs which are significant. The raw materials can be as simple as corn stalks and scrap petroleum-based vehicle tires, but used tires are an expensive feedstock with other more-valuable uses. GM has over 4 million E85 cars on the road now, and by 2012 half of the production cars for the U.S. will be capable of running on E85 fuel, however by 2012 the supply of ethanol will not even be close to supplying this much E85. Coskata Inc. is building two new plants for the ethanol fuel. Theoretically, the process is claimed to be five times more energy efficient than corn based ethanol, however it is still in development and has not been proven to be cost effective in a free market.

    The greenhouse gas emissions are reduced by 86% for cellulose compared to corn’s 29% reduction.

    Biofuels in developing countries

    Biofuel industries are becoming established in many developing countries. Many developing countries have extensive biomass resources that are becoming more valuable as demand for biomass and biofuels increases. The approaches to biofuel development in different parts of the world varies. Countries such as India and China are developing both bioethanol and biodiesel programs. India is extending plantations of jatropha, an oil-producing tree that is used in biodiesel production. The Indian sugar ethanol program sets a target of 5% bioethanol incorporation into transport fuel China is a major bioethanol producer and aims to incorporate 15% bioethanol into transport fuels by 2010. Costs of biofuel promotion programs can be very high, though.

    Amongst rural populations in developing countries, biomass provides the majority of fuel for heat and cooking. Wood, animal dung and crop residues are commonly burned. Figures from the International Energy Agency show that biomass energy provides around 30% of the total primary energy supply in developing countries; over 2 billion people depend on biomass fuels as their primary energy source.

    The use of biomass fuels for cooking indoors is a source of health problems and pollution. 1.3 million deaths were attributed to the use of biomass fuels with inadequate ventilation by the International Energy Agency in its World Energy Outlook 2006. Proposed solutions include improved stoves and alternative fuels. However, fuels are easily damaged, and alternative fuels tend to be expensive. Very low cost, fuel efficient, low pollution biomass stove designs have existed since 1980 or earlier.[43] Issues are a lack of education, distribution, excess corruption, and very low levels of foreign aid. People in developing countries are often unable to afford these solutions without assistance or financing such as microloans. Organizations such as Intermediate Technology Development Group work to make improved facilities for biofuel use and better alternatives accessible to those who cannot get them.

    Current issues in biofuel production and use

    Biofuels are proposed as having such benefits as: reduction of greenhouse gas emissions, reduction of fossil fuel use, increased national energy security, increased rural development and a sustainable fuel supply for the future.

    However, biofuel production is questioned from a number of angles. The chairman of the International Panel on Climate Change, Rajendra Pachauri, notably observed in March 2008 that questions arise on the emissions implications of that route, and that biofuel production has clearly raised prices of corn, with an overall implication for food security.

    Biofuels are also seen as having limitations. The feedstocks for biofuel production must be replaced rapidly and biofuel production processes must be designed and implemented so as to supply the maximum amount of fuel at the cheapest cost, while providing maximum environmental benefits. Broadly speaking, first generation biofuel production processes cannot supply us with more than a few percent of our energy requirements sustainably. The reasons for this are described below. Second generation processes can supply us with more biofuel, with better environmental gains. The major barrier to the development of second generation biofuel processes is their capital cost: establishing second generation biodiesel plants has been estimated at €500million.

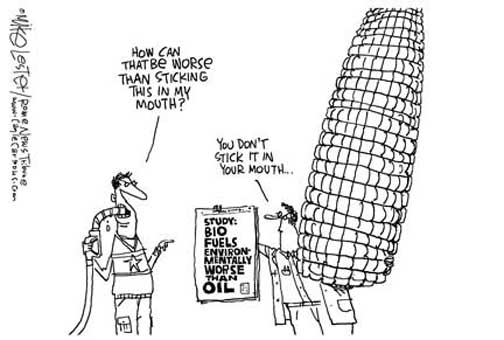
    Recently, an inflexion point about advantages/disadvantages of biofuels seems to be gaining momentum. The March 27, 2008 TIME magazine cover features the subject under the title "The Clean Energy Myth":

    Politicians and Big Business are pushing biofuels like corn-based ethanol as alternatives to oil. All they’re really doing is driving up world food prices, helping to destroy the Amazon jungle, and making global warming worse.

    In the June, 2008 issue of the journal Conservation Biology, scientists argue that because such large amounts of energy are required to grow corn and convert it to ethanol, the net energy gain of the resulting fuel is modest. Using a crop such as switchgrass, common forage for cattle, would require much less energy to produce the fuel, and using algae would require even less. Changing direction to biofuels based on switchgrass or algae would require significant policy changes, since the technologies to produce such fuels are not fully developed.

    Oil price moderation

    The International Energy Agency's World Energy Outlook 2006 concludes that rising oil demand, if left unchecked, would accentuate the consuming countries' vulnerability to a severe supply disruption and resulting price shock. The report suggested that biofuels may one day offer a viable alternative, but also that "the implications of the use of biofuels for global security as well as for economic, environmental, and public health need to be further evaluated".

    Economists disagree on the extent that biofuel production affects crude oil prices. According to the Francisco Blanch, a commodity strategist for Merrill Lynch, crude oil would be trading 15 per cent higher and gasoline would be as much as 25 per cent more expensive, if it were not for biofuels. Gordon Quaiattini, president of the Canadian Renewable Fuels Association, argued that a healthy supply of alternative energy sources will help to combat gasoline price spikes. However, the Federal Reserve Bank of Dallas concluded that "Biofuels are too limited in scale and currently too costly to make much difference to crude oil pricing."

    Rising food prices — the "food vs. fuel" debate

    Main article: food vs fuel

    This topic is internationally controversial. There are those, such as the National Corn Growers Association, who say biofuel is not the main cause. Some say the problem is a result of government actions to support biofuels. Others say it is just due to oil price increases. The impact of food price increases is greatest on poorer countries. Some have called for a freeze on biofuels. Some have called for more funding of second generation biofuels which should not compete with food production so much. In May 2008 Olivier de Schutter, the United Nations food adviser, called for a halt on biofuel investment. In an interview in Le Monde he stated: "The ambitious goals for biofuel production set by the United States and the European Union are irresponsible. I am calling for a freeze on all investment in this sector." 100 million people are currently at risk due to the food price increases.

    Carbon emissions

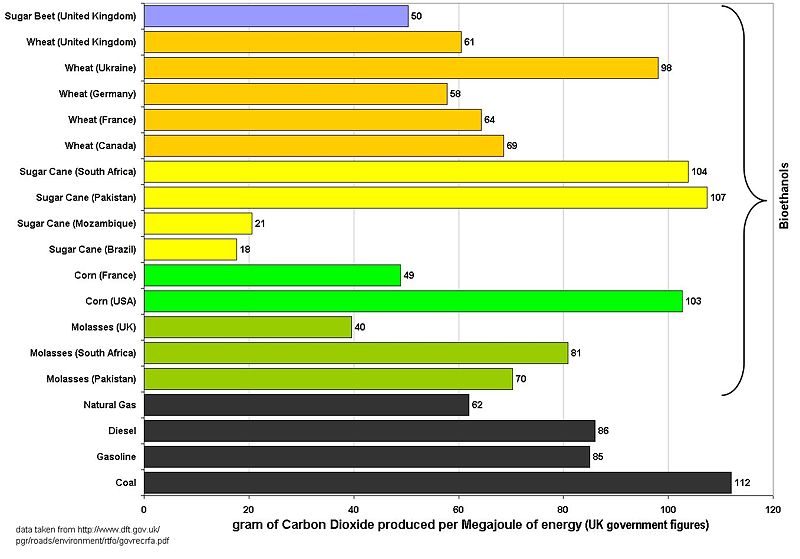
    Graph of UK figures for the carbon intensity of bioethanol and fossil fuels. This graph assumes that all bioethanols are burnt in their country of origin and that prevously existing cropland is used to grow the feedstock.

    Biofuels and other forms of renewable energy aim to be carbon neutral or even carbon negative. Carbon neutral means that the carbon released during the use of the fuel, e.g. through burning to power transport or generate electricity, is reabsorbed and balanced by the carbon absorbed by new plant growth. These plants are then harvested to make the next batch of fuel. Carbon neutral fuels lead to no net increases in human contributions to atmospheric carbon dioxide levels, reducing the human contributions to global warming. A carbon negative aim is achieved when a portion of the biomass is used for carbon sequestration. Calculating exactly how much greenhouse gas (GHG) is produced in burning biofuels is a complex and inexact process, which depends very much on the method by which the fuel is produced and other assumptions made in the calculation.

    Carbon emissions have been increasing ever since the industrial revolution. Prior to the industrial revolution, our atmosphere contained about 280 parts per million of carbon dioxide. After burning coal, gas, and oil to power our lives, the concentration had risen to 315 parts per million. Today, it is at the 380 level and still increasing by approximately two parts per million annually. During this time frame, the global average temperature has risen by more than 1°F since carbon dioxide traps heat near the Earth’s surface. Scientists believe that if the level goes beyond 450 parts per million, the temperature jump will be so great that we will be faced with an enormous rise in sea level due to the melting of Greenland and West Antarctic ice sheets.

    The carbon emissions (Carbon footprint) produced by biofuels are calculated using a technique called Life Cycle Analysis (LCA). This uses a "cradle to grave" or "well to wheels" approach to calculate the total amount of carbon dioxide and other greenhouse gases emitted during biofuel production, from putting seed in the ground to using the fuel in cars and trucks. Many different LCAs have been done for different biofuels, with widely differing results. The majority of LCA studies show that biofuels provide significant greenhouse gas emissions savings when compared to fossil fuels such as petroleum and diesel.[citation needed] Therefore, using biofuels to replace a proportion of the fossil fuels that are burned for transportation can reduce overall greenhouse gas emissions. The well-to-wheel analysis for biofuels has shown that first generation biofuels can save up to 60% carbon emission and second generation biofuels can save up to 80% as opposed to using fossil fuels. However these studies do not take into account emissions from nitrogen fixation, deforestation, land use, or any indirect emissions.

    In October 2007, a study was published by scientists from Britain, U.S., Germany and Austria, including Professor Paul Crutzen, who won a Nobel Prize for his work on ozone. They reported that the burning of biofuels derived from rapeseed and corn (maize) can contribute as much or more to global warming by nitrous oxide emissions than cooling by fossil fuel savings. Nitrous oxide is both a potent greenhouse gas and a destroyer of atmospheric ozone. But they also reported that crops with lower requirements for nitrogen fertilizers, such as grasses and woody coppicing will result in a net absorption of greenhouse gases.

    In February 2008, two articles were published in Science which investigated the GHG emissions effects of the large amount of natural land that is being converted to cropland globally to support biofuels development. The first of these studies, conducted at the University of Minnesota, found that:

    ...converting rainforests, peatlands, savannas, or grasslands to produce food-based biofuels in Brazil, Southeast Asia, and the United States creates a ‘biofuel carbon debt’ by releasing 17 to 420 times more CO2 than the annual greenhouse gas (GHG) reductions these biofuels provide by displacing fossil fuels.

    This study not only takes into account removal of the original vegetation (as timber or by burning) but also the biomass present in the soil, for example roots, which is released on continued plowing. It also pointed out that:

    ...biofuels made from waste biomass or from biomass grown on degraded and abandoned agricultural lands planted with perennials incur little or no carbon debt and can offer immediate and sustained GHG advantages.

    The second study, conducted at Princeton University, used a worldwide agricultural model to show that:

    ...corn-based ethanol, instead of producing a 20% savings, nearly doubles greenhouse emissions over 30 years and increases greenhouse gases for 167 years.

    Both of the Science studies highlight the need for sustainable biofuels, using feedstocks that minimize competition for prime croplands. These include farm, forest and municipal waste streams; energy crops grown on marginal lands, and algaes. These second generation biofuels feedstocks "are expected to dramatically reduce GHGs compared to first generation biofuels such as corn ethanol". In short, biofuels done unsustainably could make the climate problem worse, while biofuels done sustainably could play a leading role in solving the carbon challenge.

    Sustainable biofuel production

    Main article: Sustainable biofuel

    Responsible policies and economic instruments would help to ensure that biofuel commercialization, including the development of new cellulosic technologies, is sustainable. Sustainable biofuel production practices would not hamper food and fibre production, nor cause water or environmental problems, and would actually enhance soil fertitlity. Responsible commercialization of biofuels represents an opportunity to enhance sustainable economic prospects in Africa, Latin America and impoverished Asia.

    Soil erosion, deforestation, and biodiversity

    It is important to note that carbon compounds in waste biomass that is left on the ground are consumed by other microorganisms. They break down biomass in the soil to produce valuable nutrients that are necessary for future crops. On a larger scale, plant biomass waste provides small wildlife habitat, which in turn ripples up through the food chain. The widespread human use of biomass (which would normally compost the field) would threaten these organisms and natural habitats. When cellulosic ethanol is produced from feedstock like switchgrass and saw grass, the nutrients that were required to grow the lignocellulose are removed and cannot be processed by microorganisms to replenish the soil nutrients. The soil is then of poorer quality. Loss of ground cover root structures accelerates unsustainable soil erosion.

    Significant areas of native Amazon rainforest have been cleared by slash and burn techniques to make room for sugar cane production, which is used in large part for ethanol fuel in Brazil, and growing ethanol exports. Large-scale deforestation of mature trees (which help remove CO2 through photosynthesis — much better than does sugar cane or most other biofuel feedstock crops do) contributes to un-sustainable global warming atmospheric greenhouse gas levels, loss of habitat, and a reduction of valuable biodiversity. Demand for biofuel has led to clearing land for Palm Oil plantations.

    A portion of the biomass should be retained onsite to support the soil resource. Normally this will be in the form of raw biomass, but processed biomass is also an option. If the exported biomass is used to produce syngas, the process can be used to co-produce biochar, a low-temperature charcoal used as a soil amendment to increase soil organic matter to a degree not practical with less recalcitrant forms of organic carbon. For co-production of biochar to be widely adopted, the soil amendment and carbon sequestration value of co-produced charcoal must exceed its net value as a source of energy.

    Impact on water resources

    Increased use of biofuels puts increasing pressure on water resources in at least two ways: water use for the irrigation of crops used as feedstocks for biodiesel production; and water use in the production of biofuels in refineries, mostly for boiling and cooling.

    In many parts of the world supplemental or full irrigation is needed to grow feedstocks. For example, if in the production of corn (maize) half the water needs of crops are met through irrigation and the other half through rainfall, about 860 liters of water are needed to produce one liter of ethanol.

    In the United States, the number of ethanol factories has almost tripled from 50 in 2000 to about 140 in 2008. A further 60 or so are under construction, and many more are planned. Projects are being challenged by residents at courts in Missouri (where water is drawn from the Ozark Aquifer), Iowa, Nebraska, Kansas (all of which draw water from the non-renewable Ogallala Aquifer), central Illinois (where water is drawn from the Mahomet Aquifer) and Minnesota.

    Aldehydes

    Formaldehyde, Acetaldehyde and other Aldehydes are produced when alcohols are oxidized. When only a 10% mixture of ethanol is added to gasoline (as is common in American E10 gasohol and elsewhere), aldehyde emissions increase 40%. Some study results are conflicting on this fact however, and lowering the sulfur content of biofuel mixes lowers the acetaldehyde levels. Burning biodiesel also emits aldehydes and other potentially hazardous aromatic compounds which are not regulated in emissions laws.

    Many aldehydes are toxic to living cells. Formaldehyde irreversibly cross-links protein amino acids, which produces the hard flesh of embalmed bodies. At high concentrations in an enclosed space, formaldehyde can be a significant respiratory irritant causing nose bleeds, respiratory distress, lung disease, and persistent headaches. Acetaldehyde, which is produced in the body by alcohol drinkers and found in the mouths of smokers and those with poor oral hygene, is carcinogenic and mutagenic.

    The European Union has banned products that contain Formaldehyde, due to its documented carcinogenic characteristics. The U.S. Environmental Protection Agency has labeled Formaldehyde as a probable cause of cancer in humans.

    Brazil burns significant amounts of ethanol biofuel. Gas chromatograph studies were performed of ambient air in São Paulo Brazil, and compared to Osaka Japan, which does not burn ethanol fuel. Atmospheric Formaldehyde was 160% higher in Brazil, and Acetaldehyde was 260% higher.

    Social and Water impact in Indonesia

    In some locations such as Indonesia deforestation for Palm Oil plantations is leading to displacement of Indigenous peoples. Also, extensive use of pesticide for biofuel crops is reducing clean water supplies.

    Environmental organizations stance

    Some mainstream environmental groups support biofuels as a significant step toward slowing or stopping global climate change.[citation needed] However, biofuel production can threaten the environment if it is not done sustainably. This finding has been backed by reports of the UN, the IPCC, and some other smaller environmental and social groups as the EEB and the Bank Sarasin, which generally remain negative about biofuels.

    As a result, governmentaland environmental organisations are turning against biofuels made at a non-sustainable way (hereby preferring certain oil sources as jatropha and lignocellulose over palm oil) and are asking for global support for this. Also, besides supporting these more sustainable biofuels, environmental organisations are redirecting to new technologies that do not use internal combustion engines such as hydrogen and compressed air.

    The "Roundtable on Sustainable Biofuels" is an international initiative which brings together farmers, companies, governments, non-governmental organizations, and scientists who are interested in the sustainability of biofuels production and distribution. During 2008, the Roundtable is developing a series of principles and criteria for sustainable biofuels production through meetings, teleconferences, and online discussions.

    The increased manufacture of biofuels will require increasing land areas to be used for agriculture. Second and third generation biofuel processes can ease the pressure on land, because they can use waste biomass, and existing (untapped) sources of biomass such as crop residues and potentially even marine algae.

    In some regions of the world, a combination of increasing demand for food, and increasing demand for biofuel, is causing deforestation and threats to biodiversity. The best reported example of this is the expansion of oil palm plantations in Malaysia and Indonesia, where rainforest is being destroyed to establish new oil palm plantations. It is an important fact that 90% of the palm oil produced in Malaysia is used by the food industry; therefore biofuels cannot be held solely responsible for this deforestation. There is a pressing need for sustainable palm oil production for the food and fuel industries; palm oil is used in a wide variety of food products. The Roundtable on Sustainable Biofuels is working to define criteria, standards and processes to promote sustainably produced biofuels. Palm oil is also used in the manufacture of detergents, and in electricity and heat generation both in Asia and around the world (the UK burns palm oil in coal-fired power stations to generate electricity).

    Significant area is likely to be dedicated to sugar cane in future years as demand for ethanol increases worldwide. The expansion of sugar cane plantations will place pressure on environmentally-sensitive native ecosystems including rainforest in South America. In forest ecosystems, these effects themselves will undermine the climate benefits of alternative fuels, in addition to representing a major threat to global biodiversity.

    Although biofuels are generally considered to improve net carbon output, biodiesel and other fuels do produce local air pollution, including nitrogen oxides, the principal cause of smog.

    Potential for poverty reduction

    Researchers at the Overseas Development Institute have argued that biofuels could help to reduce poverty in the developing world, through increased employment, wider economic growth multipliers and energy price effects. However, this potential is described as 'fragile', and is reduced where feedstock production tends to be large scale, or causes pressure on limited agricultural resources: capital investment, land, water, and the net cost of food for the poor.

    With regards to the potential for poverty reduction or exacerbation, biofuels rely on many of the same policy, regulatory or investment shortcomings that impede agriculture as a route to poverty reduction. Since many of these shortcomings require policy improvements at a country level rather than a global one, they argue for a country-by-country analysis of the potential poverty impacts of biofuels. This would consider, among other things, land administration systems, market coordination and prioritising investment in biodiesel, as this 'generates more labour, has lower transportation costs and uses simpler technology'.

     Biofuel prices

    Retail, at the pump prices, including U.S. subsidies, Federal and state motor taxes, B2/B5 prices for low-level Biodiesel (B2-B5) are lower than petroleum diesel by about 12 cents, and B20 blends are the same per unit of volume as petrodiesel.

    Due to the 1/3 lower energy content of ethanol fuel, even the heavily-subsidized net cost to drive a specific distance in flexible-fuel vehicles is higher than current gasoline prices.

    Energy efficiency and energy balance of biofuels

    Production of biofuels from raw materials requires energy (for farming, transport and conversion to final product, and the production / application of fertilizers, pesticides, herbicides, and fungicides), and has environmental consequences.

    The energy balance of a biofuel is determined by the amount of energy put into the manufacture of fuel compared to the amount of energy released when it is burned in a vehicle. This varies by feedstock and according to the assumptions used. Biodiesel made from sunflowers may produce only 0.46 times the input rate of fuel energy. Biodiesel made from soybeans may produce 3.2 times the input rate of fossil fuels. This compares to 0.805 for gasoline and 0.843 for diesel made from petroleum. Biofuels may require higher energy input per unit of BTU energy content produced than fossil fuels: petroleum can be pumped out of the ground and processed more efficiently than biofuels can be grown and processed. However, this is not necessarily a reason to use oil instead of biofuels, nor does it have an impact on the environmental benefits provided by a given biofuel.

    Studies have been done that calculate energy balances for biofuel production. Some of these show large differences depending on the biomass feedstock used and location.

    To explain one specific example, a June 17, 2006 editorial in the Wall. St. Journal stated, "The most widely cited research on this subject comes from Cornell's David Pimental and Berkeley's Ted Patzek. They've found that it takes more than a gallon of fossil fuel to make one gallon of ethanol — 29% more. That's because it takes enormous amounts of fossil-fuel energy to grow corn (using fertilizer and irrigation), to transport the crops and then to turn that corn into ethanol."]

    Life cycle assessments of biofuel production show that under certain circumstances, biofuels produce only limited savings in energy and greenhouse gas emissions. Fertiliser inputs and transportation of biomass across large distances can reduce the GHG savings achieved. The location of biofuel processing plants can be planned to minimize the need for transport, and agricultural regimes can be developed to limit the amount of fertiliser used for biomass production. A European study on the greenhouse gas emissions found that well-to-wheel (WTW) CO2 emissions of biodiesel from seed crops such as rapeseed could be almost as high as fossil diesel. It showed a similar result for bio-ethanol from starch crops, which could have almost as many WTW CO2 emissions as fossil petrol. This study showed that second generation biofuels have far lower WTW CO2 emissions.

    Other independent LCA studies show that biofuels save around 50% of the CO2 emissions of the equivalent fossil fuels. This can be increased to 80-90% GHG emissions savings if second generation processes or reduced fertiliser growing regimes are used. Further GHG savings can be achieved by using by-products to provide heat, such as using bagasse to power ethanol production from sugarcane.

    Collocation of synergistic processing plants can enhance efficiency. One example is to use the exhaust heat from an industrial process for ethanol production, which can then recycle cooler processing water, instead of evaporating hot water that warms the atmosphere.

    Biofuels and solar energy efficiency

    Biofuels from plant materials convert energy that was originally captured from solar energy via photosynthesis. A comparison of conversion efficiency from solar to usable energy (taking into account the whole energy budgets) shows that photovoltaics are 100 times more efficient than corn ethanol[104] and 10 times more efficient than the best biofuel

    Centralised vs. decentralised production

    There is debate around the best model for production.

    One side sees centralised vegetable oil fuel production offering

    • efficiency
    • greater potential for fuel standardisation
    • ease of administrating taxes
    • possibility for rapid expansion

    The other side of the argument points to

    • increased fuel security
    • rural job creation
    • less of a 'monopolistic' or 'oligopolistic' market due to the increased number of producers
    • benefits to local economy as a greater part of any profits stay in the local economy
    • decreased transportation and greenhouse gases of feedstock and end product
    • consumers close to and able to observe the effects of production

    The majority of established biofuel markets have followed the centralised model with a few small or micro producers holding a minor segment of the market. A noticeable exception to this has been the pure plant oil (PPO) market in Germany which grew exponentially until the beginning of 2008 when increasing feedstock prices and the introduction of fuel duty combined to stifle the market. Fuel was produced in hundreds of small oil mills distributed throughout Germany often run as part of farm businesses.

    Initially fuel quality could be variable but as the market matured new technologies were developed that made significantly improvements. As the technologies surrounding this fuel improved usage and production rapidly increased with rapeseed oil PPO forming a significant segment of transportation biofuels consumed in 2007.

    See also

     
    Wikinews has related news:

    Energy from Biofuels: The Greening of America

    Click here to download or view this brochure in PDF format (420 k)

    Fast forward: Twenty years down the road, you drive up to a fuel pump and notice that the labels have changed. Instead of "regular," "midgrade," and "premium," the pumps offer "poplar," "willow," and "switchgrass." § The labels may never read quite that way, but there's a fair chance that within a decade the liquid gushing out the nozzle and into your car will have its roots in a farm field rather than an oil field. The Office of Energy Efficiency and Renewable Energy in the U.S. Department of Energy (DOE) is laying the groundwork for a new class of fuels, called biofuels, made from fast- growing trees, shrubs, and grasses, known collectively as biomass crops.

    Biofuels offer several important advantages over fossil fuels such as petroleum and coal. Biofuels recycle carbon dioxide during each growing season, taking it from the air and converting it into biomass, rather than simply releasing carbon from prehistory's warehouse, as burning coal or oil does. They're renewable, so they don't deplete Earth's limited natural resources. They're based on agriculture—on energy crops—so they're good for America's rural farm economy. And, they're domestically produced, not imported.

    About half the nation's oil today is imported—far more than at the time of the oil embargoes of the 1970s, when DOE began exploring the potential of biofuels. Most of today's oil imports still come from parts of the world that are politically volatile. Greater reliance on domestic energy resources—renewable domestic energy resources—is a smart policy. In an important step toward that policy, DOE is sponsoring a program of biomass research, involving scientists at universities, private companies, and federal laboratories across the nation.

    About half the nation's oil today is imported—far more than at the time of the oil embargoes of the 1970s, when DOE began exploring the potential of biofuels. Most of today's oil imports still come from parts of the world that are politically volatile. Greater reliance on domestic energy resources—renewable domestic energy resources—is a smart policy. In an important step toward that policy, DOE is sponsoring a program of biomass research, involving scientists at universities, private companies, and federal laboratories across the nation.

     Poplar Tree   Man in switchgrass

    Fast-growing trees and grasses, grown as energy crops, could yield billions of gallons of biofuels each year.

    One part of the DOE program focuses on the technology to convert energy crops into liquid fuels, such as ethanol, to power the nearly 200 million vehicles on U.S. roads. Ethanol, a form of alcohol, is already the most common biofuel. U.S. production of ethanol—mainly from corn—is approaching 1.5 billion gallons per year. The DOE program is aiming far higher, though, by developing technologies for converting many different types of biomass to fuels more efficiently, with little waste. Such conversion technologies are being developed by DOE's National Renewable Energy Laboratory.

    The other part of the program focuses on developing hardy, high-yield crops that are virtually designed with energy production in mind. Overseeing this effort is the Biofuels Feedstock Development Program, located at Oak Ridge National Laboratory (ORNL), one of the nation's largest and most experienced energy-research centers.

    Down on the farm

    Aerial view of landscape

     Corridors of energy crops can bridge the gap between areas of natural forest or prairie.

    Most people know that some American farmers have a tough time turning a profit. Fewer people realize that farmers are victims, in part, of their own success. Dramatic gains in farm productivity have led to increased production from less land. The result? Falling prices, shrinking profits, and growing tracts of surplus land. During the 1990s, for instance, an average of 50 to 55 million acres of agricultural land have been taken out of production each year for conservation and economic reasons.

    ORNL researchers envision biomass crops on much of that farmland—especially land that's erosion-prone or, for other environmental reasons, unsuitable for row crops. One biomass crop that can readily be grown on most cropland is switchgrass, a native American prairie grass. Because it's sometimes used for hay—and planted to control erosion— switchgrass is already familiar to some farmers. Also promising are fast-growing trees and shrubs such as hybrid poplars and willows. Both tree and grass crops can produce annual yields as high as 10 dry tons of biomass per acre—enough to make 1,000 gallons of ethanol per acre every year.

    If two-thirds of the nation's idled cropland were used to grow energy crops, the result could be dramatic: those 35 million acres could produce between 15 and 35 billion gallons of ethanol each year to fuel cars, trucks, and buses.

    Harvesting and chipping

    Fast-growing cottonwoods being harvested for paper and energy.

    Banking on biomass

    Dick Schultz stands on an Iowa streambank and looks upstream and down. The banks are thickly clustered with willows; alongside grow silver maples, ash, and hybrid poplars. A strip of waist-high switchgrass borders the trees, separating them from a large cornfield. Between the stream's gently sloping banks, the water flows slowly and clearly.

    Three years earlier, the view from this same spot was far different, says Schultz, a forestry researcher at Iowa State University. Cornstalks ran all the way to the bank, some tipping crazily off the edges. The stream ran hard and fast between steep, collapsing banks. Drainage lines dumped runoff water laden with fertilizer and insecticides directly into the stream.

    What's saving this stream is a buffer zone of trees and grass—in other words, biomass. Just 22 yards wide, the buffer zone protects the stream's banks and water from erosion, siltation, and chemical runoff. Eventually, Schultz hopes to see hundreds more miles of rivers and streams protected by thousands more acres of buffer zones. He also hopes to see those buffer zones harvested regularly for biomass—the switchgrass annually, the trees every 10 years, perhaps—to produce income for farmers and energy for America.

    Winging it

    At 6:07 a.m., Wayne Hoffman stops at the edge of a stand of trees. He turns in a slow circle, scanning intently, listening keenly. At precisely 6:12, he wheels and heads into the interior of the tract, then stops abruptly to listen and look again. Fugitive? Soldier of fortune? Scientist.

    Hoffman is a research biologist with the National Audubon Society, and he's here—in a large tract of hybrid cottonwoods in western Oregon—to see how biomass crops affect wildlife habitat. These trees are on James River Corporation's Lower Columbia River Fiber Farm. James River will use them for paper and energy, but they're a result of DOE's energy crop research, growing like the energy crops envisioned by ORNL. Now in their sixth growing season, these fast-growing cottonwoods already reach 60 feet or higher, with trunks up to 10 inches in diameter.

    During his five-minute count on the edge of the cottonwoods, Hoffman notes an American robin, a song sparrow, a Pacific Slope flycatcher, a Swainson's thrush, another robin, a black-headed grosbeak, and a goldfinch. After counts at four more points inside the plantation, he's logged a total of 26 birds, representing 9 different species.

    Rodent found in field

    Produced for DOE's Office of Transportation Technologies and the Office of Power Technologies within the Office of Energy Efficiency and Renewable Energy.

    DOE logo


    FROM: http://bioenergy.ornl.gov/papers/misc/greening.html

      Energy Crops provide better wildlife habitat than row crops.

    Hoffman has also assessed the habitat quality of a 50-acre stand of switchgrass in Iowa. In forty minutes of bird-counting in the switchgrass, Hoffman logs 15 different species, 62 birds in all.

    Hoffman's conclusion about energy crops? "As a replacement for row crops, biomass is an improvement for wildlife," he says. "These crops also have the potential to be very useful not just for fuels, but for other land-management purposes as well— for example, as ecological corridors to bridge the gap between areas of natural forest."

    The growing potential of biomass

    On thousands of acres of farmland in Minnesota and Iowa, farmers, scientists, and policy makers are getting a sneak preview of what the future may hold for energy crops. In Minnesota, 5,000 acres— most of it land deemed erosion-prone and requiring special car to protect soils—is being planted with millions of hybrid poplars. decade from now, some of these trees will be harvested, mixed w coal, and burned to spin a powe company's turbines. The rest will be available for other uses, including production of ethano or other transportation fuels.

    Leaves as solar collectors

    Fast-growing hardwoods, such as hybrid poplars and sycamores, are efficient solar collectors, gathering the sun's energy and converting it to useful chemical energy.

    In four counties in southern Iowa the harvest may begin far soone Plans are being made to plant switchgrass on approximately 4,000 acres. The project is attracting the interest of area power companies, which could mix the switchgrass with coal to reduce emissions and expand use of renewable energy.

    Both projects—largest of their kind in the nation—are cooperative efforts involving DOE, area farmers, universities, the U.S. Department of Agriculture, energy industries, and state and local agricultural and forestry agencies. According to ORNL's Mark Downing, who helped orchestrate the efforts, these large-scale plantings will provide unprecedented experience and data and turn once-idle land into productive sources of biofuels. Good results could speed the growth of a strong national biofuels program for both power production and transportation fuels.

    By finding ways to boost biomass productivity, capitalize on its environmental advantages, and convert it efficiently into fuels and power, DOE, ORNL, and their research partners across the nation are working to make sure that when the time comes, biomass is ripe for the harvest.


    For more information, contact:
    Bioenergy Feedstock Development Program
    Oak Ridge National Laboratory
    P.O. Box 2008
    Oak Ridge, TN 37831-6422
    865-576-8143 (fax)


    WAITING FOR THE TRAIN


    On October 19, 2006, East Japan Railway Company (JR East) made a test run of its NE Train (New Energy Train) — the world’s first fuel cell hybrid train — in Yokohama’s Kanazawa ward.

    With two 65-kilowatt fuel cells and six hydrogen tanks under the floor and a secondary battery on the roof, the clean train emits only water and runs without receiving juice from power lines. The train can travel at a maximum speed of 100 kph (60 mph) for 50 to 100 km (30 to 60 miles) without a hydrogen refill.

    Thirty passengers boarded the train for the test run, which consisted of a series of back-and-forth jaunts along a 300-meter test track. The train smoothly accelerated to a maximum speed of 50 kph (30 mph), providing a ride quality no different from an ordinary train.

    A separate fuel cell train is under development by the Railway Technical Research Institute (RTRI), but the NE Train differs in that it is a hybrid relying on a secondary battery that stores electricity generated during braking. The secondary battery provides auxiliary power during acceleration or when fuel cell power is insufficient.

    JR East hopes to see hybrid commuter trains in widespread use in 10 to 20 years. Lowering the cost and improving the mileage of fuel cells is a serious challenge, but the effort is not without reward. In addition to environmental benefits, eliminating the need for unsightly power lines means lower infrastructure costs and a prettier landscape to look at from the train window.

    Testing of the train on public tracks will begin next April.

    SEE - GREAT CARS

    http://www.pinktentacle.com/tag/transportation/page/3/


    RECYCLE

    This feels so much like our office
    Dee & Joe

    ENERGY DATABASE ON THIS SITE

    GAIA'S REVENGE

    DREAMS OF THE GREAT EARTHCHANGES - MAIN INDEX