Market Cycles and Fibonacci of W.D.Gann
Technical Analysis - Menu
1. Technical Analysis - Elliott Wave, Gann and Chart Patterns
5. Market Cycles and Fibonacci
Market Cycles and Fibonacci
The relevance of trading with TIME-cycles alone is far less accurate than forecasting with PRICE. But its relevance will increase if, as the forecasted times approach, price patterns and momentum indicators show signs of reversal. Also, when trading markets like futures and commodities, the capital required to cover risks can be large due to leverage. Therefore, these long-term cycles only provide useful information in a limited capacity.
I discuss cycles here to illustrate:
- How several long-term cycles have accurately predicted significant market turning points.
- The amazing mathematical "coincidences" I have discovered while searching for an accurate market-timing method.
You may wish to bare this information in mind if trading long-term markets, such as stocks, possibly options or perhaps long-term index futures where a turning point is possible?
In the final two parts of this course (19 and 20) I will go through many examples of trading, on different time frames, using all the information shown throughout the course: A kind of "How to put all the information together".
For now, I hope you find this cycles information as fascinating as I do.
Gann and Fibonacci Relationships in the Universe
Below are some cycles that have been found by scientists and astronomers when studying the universe. Numbers that we have seen through this course (such as numbers that are or are near to Fibonacci numbers, or Gann multiples and fractions, are highlighted).
Note a tremendous amount of Fibonacci relationships!
Also, one of Gann’s major techniques for market timing was to use fractions of a circle, specifically into quarters, eighths and thirds, to count the number of days/weeks/months between highs and lows. For example, the circle has 360 degrees, 90 is one quarter, 45 is one eighth. Important numbers to count between highs/lows are therefore 30, 45, 60, 90, 135, (90 + 45), 150, 180, 210, 225, 270, 315, 330 and 360.
Rounding up one eighth of 90 is 11, two-eighths is 22, three-eighths is 33, 45, 56, 67, 78 and 90. These are other numbers to look out for.
Common Numbers in Solar Activity (in Earth Years):
Common Numbers |
Fibonacci |
Part (%) of... |
Gann |
Other |
Days + |
1.09 |
Fibonacci 1 |
One plus 9/100 |
. |
. |
. |
1.5 |
. |
. |
Gann 150 |
. |
. |
2.2 |
Fibonacci 2 and 2.236 |
Gann 2/8 of 90 = 22 |
. |
. |
. |
2.7 |
Fibonacci 2.618 |
. |
Gann 3 x 90 / 100 |
. |
. |
3.5 |
Fibonacci 34 /10 |
33 is 3/8 of 90 |
Gann 350% |
. |
. |
4.4 |
Fibonacci 4.236 |
. |
Gann 45 / 10 |
. |
. |
5.5 |
(Fibonacci 5 and 55 |
Gann 56 is 5/8 of 90) |
. |
. |
. |
8 (Fibonacci 8) |
Fibonacci 8 |
. |
. |
. |
. |
10.2 |
Fibonacci 1 x 10 |
90 plus one-eighth of 90 |
Gann 10 |
eleven = 101 |
. |
11 |
. |
. |
Gann 1/8 of 90 |
. |
. |
15 (Gann 1.5 x 10) |
. |
. |
Gann 1.5 x 10 |
. |
. |
12 |
Fibonacci 144 = 12x12 |
. |
. |
. |
. |
17 |
. |
. |
. |
. |
7days in a week + 10 |
22.2 |
Fibonacci 21 |
2.236 x 10 |
Gann 22 = |
2/8 of 90 |
. |
26 |
Fibonacci 2.618 x 10 |
25 is a Gann% of 100) |
. |
. |
. |
34 (Fibonacci 34. Gann 33 is 3/8 of 90) |
Fibonacci 34 |
Gann 33 is 3/8 of 90) |
. |
. |
. |
45) |
Fibonacci 89 |
Gann 45 degrees |
. |
. |
. |
59 |
Fibonacci 55 |
Gann 56 is 5/8 of 90 |
. |
. |
. |
85 |
Fibonacci 89 |
. |
85 (near to Fibonacci 89, Gann 90) |
. |
. |
96 |
Fibonacci 8 x 12 |
. |
Gann 100% |
. |
. |
169 |
Fibonacci 1.618 x 100 |
168 is 90 +7/8 of 90) |
. |
. |
. |
178 |
Fibonacci 377 Đ 200 = 177 |
. |
. |
180 degrees in a circle |
. |
200 |
Fibonacci 2 x 100 |
. |
Gann 200% |
. |
. |
400 |
Fibonacci 2 x 200 |
. |
Gann 400% |
. |
. |
600 |
Fibonacci 3 x 200 |
. |
Gann 200% x 3 |
. |
. |
900 |
Fibonacci 89 x 10 |
. |
Gann 300% x 3 |
. |
. |
2400 |
Fibonacci 233 x 10) |
. |
. |
. |
. |
Humanistic, Historical Points (in years):
Historical Points |
Fibonacci |
Gann |
Other |
4.3 |
Fibonacci 4.236 |
. |
. |
5.2 |
Fibonacci 5 |
. |
. |
7.1 |
. |
. |
7 days in a week |
10.5 |
Fibonacci 5 x 2 |
Gann 10 multiple |
. |
12.5 |
Fibonacci 13 |
Gann 12 |
. |
16.1 |
Fibonacci 1.618 x 10 |
. |
. |
22.0 |
Fibonacci 21 |
Gann 2/8 of 90 |
. |
35 |
Fibonacci 34 |
Gann 350% |
. |
55 |
(Fibonacci 55 |
. |
. |
130 |
Fibonacci 13 x 10 |
. |
. |
170 |
. |
. |
168 is 90 + 7/8 of 90 |
200 |
. |
Gann 200% |
. |
263 |
Fibonacci 2.618 x 100 |
. |
. |
317 |
Fibonacci 34 |
Gann 350 - Fibonacci 34 = 316 |
. |
350 (Gann 350%, ten times Fibonacci 34 = 340) |
. |
350 |
. |
Problems with Counting Cycles
As well as regular cycles there are random fluctuations in things, too. The random occurrences can camouflage the regular cycles and also generate what appear to be new, smaller cycles, which they may not be. If you are zealous enough you can find regularity in almost anything, including random numbers where you know that the regularity has no significance and know it will not continue. This is the problem with market-timing signals.
Also, many things act as if they are influenced simultaneously by several different rhythmic forces, the composite effect of which is not regular at all.
The cycles may have been present in the figures you have been studying merely by chance. The ups and downs you have noticed which come at more or less regular time intervals may have just happened to come that way. The regularity - the cycle - is there all right, but in such circumstances it has no significance.
The following examples illustrate this problem of cycles appearing/disappearing.
Cycles in the Stock Market
When forecasting stock market cycles, the cycles are influenced by random events. Cycles are inherently unreliable and their predictive value provides only specific probabilities when the suggested time period is approached.
Fixed time cycles are apparent in stock market tops and bottoms. But eventually a cycle will cease to continue. For example, the four-year cycle in the US stock market held true from 1954 to 1982 producing accurate forecasts of 8 market bottoms. Had an investor recognized the cycle in 1962, he could have amassed a fortune over the next 20-years. But in 1986, the cycle’s prediction of a low failed to provide a bear market and in 1987 its rising portion failed to prevent the largest crash since 1929.
Another cycle that may have disappeared is the 3-year cycle that began in 1975, forecasting lows in 1978, 1981, 1984, 1987 and 1990 – there was no significant bottom in 1993, 1996 or 1999.
Other long-term cycles (such as Kondratieff and Benner/Fibonacci) as well as Elliott Wave counts, suggest that the ultra long-term bull market may be coming to an end.
Therefore, many old or existing cycles may come to an end and new ones begin.
It is difficult at the best of times to recognize a cycle taking place, but with the high probability of a reversal in ultra long-term trend at the time of writing (March 2002) it is even harder to confirm. Nevertheless, the text below explains how a lot of cycles have been seen on the long-term US stock market.
Fibonacci Relationships in the Stock Market Cycles
1 year is a little less than 13 months, a little less than 55 weeks and a little less than 377 days. Thus a Fibonacci time period in one natural duration is close to a Fibonacci duration in another.
The Kondratieff Cycle is a common, often-quoted cycle of financial and economic behavior that lasts approximately 54 years. This 54-year cycle is very close to a Fibonacci 55 number!
The 54 (55) year cycle was recognized by the Maya tribes of ancient Central America, the ancient Israelites, and rediscovered in the 1920’s by Russian economist Nikolai Kondratieff (hence the name of the Kondratieff Cycle.)
Fractions of the Kondratieff Cycle (54 Years)
Dividing the Kondratieff Cycle of 54 years by 2 equals 27 years, and dividing by 2 again equals 13.5 years. This is near to a Fibonacci number 13 and, 13.5 years multiplied by 12 months equals 162 months – a Fibonacci 1.62!
Dividing 54 by 3 equals 18 years and dividing this by 2 equals 9 years, or 108 months. Dividing by 2 again leaves a smaller cycle of 4.5 years, which is 54 months – almost a Fibonacci 55!
Two-thirds of 54 equals 36 years. 5-times 36 years gives 180 years. This is the same as 180 degrees is half a circle, or half a planetary orbit.
All these periods are inter-linked by Fibonacci! How bizarre!
Remember that the proportion of two-thirds was used greatly by Gann. It is also near to a Fibonacci 0.618 ratio.
Let us take a look at a long-term chart illustrating the Kondratieff cycle:
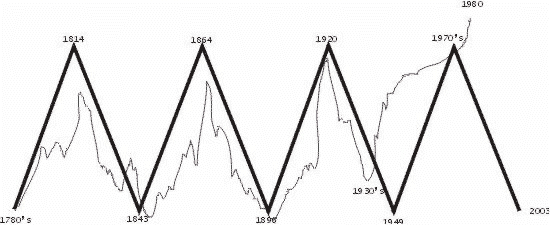
Figure 333: Kondratieff 54-Year Cycle over US Wholesale Prices.
Also, on the US stock market, the Kondratieff Cycle appears to subdivide into harmonic sub-cycles of between 16 and 20 years. The last set of sub-cycles saw US stock market lows in 1842, (+17) 1859, (+18) 1877, (+19) 1896, (+18) 1914, (+18) 1932, (+17) 1949, (+17) 1966 and (+16) 1982.
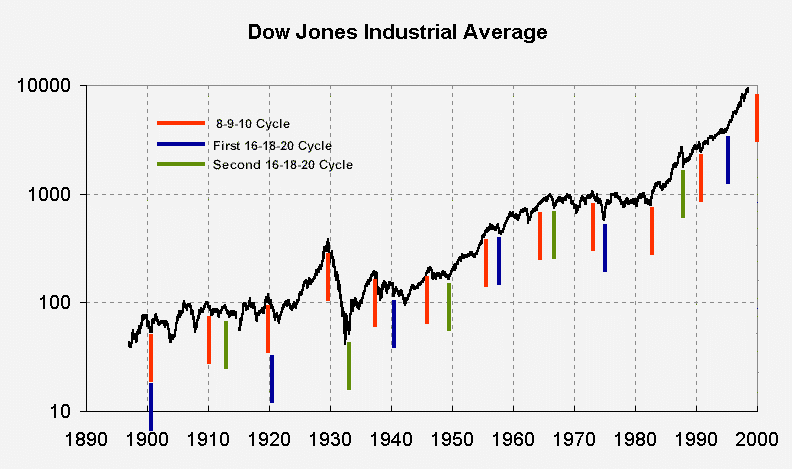
Figure 335: Long term Dow Jones showing dips on Kondratieff cycles: 1842, (+17) 1859, (+18) 1877, (+19) 1896, (+18) 1914, (+18) 1932, (+17) 1949, (+17) 1966 and (+16) 1982.
Benner Cycle
The diagram below is based on Samuel Benner’s cyclic discoveries but I have modified and updated it to fit the behavior of the stock market.
It uses 3 cyclic periods to project each reversal point.
The first cycle goes: 8-years, 9-years, 10-years, and begins in 1902. The projected lows were forecast on 1902, (+8) 1910, (+9) 1919, (+10) 1929, (+8) 1937, (+9) 1946, etc.
The next cyclic periods project reversals in years of 16-years, 18-years, 20-years (i.e. double the period of the first cycle). Starting with an 18-year period from 1903, this cycle forecast lows in 1903, (+18) 1921, (+20) 1941, (+16) 1957, (+18) 1975, etc.
The next cyclic period again uses the 16-18-20-year counts, but begin in 1913. This cycle projected market turning points on 1913, (+20) 1933, (+16) 1949, (+18) 1967, (+20) 1987, etc.
If you compare this Benner Cycle with a long-term stock market chart, you will see how it predicted many of the historic high and low turning points (Figure 335.)
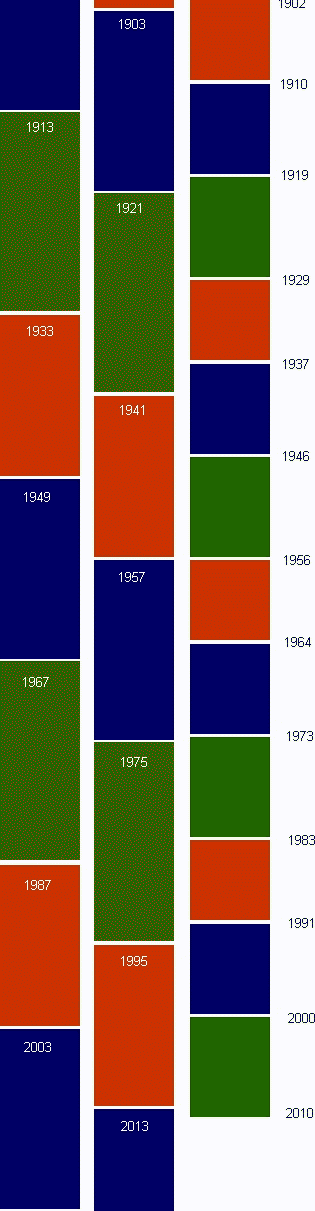
Figure 334: Benner Cycle.
Figure 335: Long-term US stock market chart showing Benner counts from Figure 334. (Note all counts of each cycle are painted the same color on this chart. E.g. 8-9-10 year counts are all red.) This cycle has accurately called significant market lows over the last 100 years.
More Recognized Cycles
The 20 Year Cycle
The 20-year cycle has accurately called the historic and dramatic lows in the US stock market in 1903, 1921, 1942, 1962 and 1982. The next target for a low on this cycle is 2002, which coincides with the Kondratieff Cycle and other signals calling for a reversal around 2002-2003. (As the market may now be in a bear market, the reversal will only be a correction holding below previous highs…. If the cycle is to continue?)
The 8 and 12 Year Cycles
The ideal years called by the 8-year cycle in the US stock market are: 1934 (1933), 1942, 1950 (1949), 1958 (1957), 1966, 1974, 1982, 1990 and 1998. (Brackets indicate actual market bottoms, otherwise year shown is an actual bottom!) The next 8-year cycle occurs again in 2006.
The 12-year cycle is less reliable but coincides well with the other historic lows. The next forecast low called by the 12-year cycle is in 2010.
The 4 Year Cycle
The 4-year cycle has been very accurate over the last 50 years, calling a majority of turning points since 1954. Recently, the 4-year cycle has hit in 1994, 1998… the next being in 2002.
The 4-year cycle is usually explained by fundamentalists as being caused by the 4-year US presidential election. Each Presidential term usually contains 2 years of down-move followed by 2-years of up move.
The 1.697 Year Period
The 1.697-year period is also interesting.
Astronomers have discovered many cycles, one of which is a weak cycle at 3.39 years. This is exactly double the 1.697 period.
The 3.39 year (40.68 month) cycle is also the dominant cycle in the US stock market and commonly called the 40 month cycle and is, according to Edward Dewey, a famous cyclic analyst, the most commonly reported cycle of all.
This finding of cycles that are exactly half as long as others is a very common occurrence. They are called harmonics. (Also remember how market prices often retrace 50%.)
Finding cycles of the same length in different series is also common.
A Background to Financial Astrology
This next section explains how some traders use Financial Astrology to forecast market cycles.
Note: I do NOT use Financial Astrology myself. I haven’t studied it a great deal and do not profess to be an expert but, firstly, I have tried the services of a couple of Financial Astrologists and found the forecasts to not be greatly accurate, mainly because they are rather ambiguous.
For example, they may say the Dow will go up from November 13th-16th, fall from 20th-17th … We all know that a lot can happen in a 3-day period!
Secondly, in the books that I have read illustrating charts with reversal signals caused by Astrological signs, I found there to be too many methods of generating signals.
For example, as well as planets changing signs (of the Zodiac) there are also Moon nodes, depogees and apogees, aspects, declinations, planets going direct or retrograde, solar and lunar eclipses, etc. to consider.
The purpose of this section is to illustrate how the astrological aspects of the planets in our solar system are related to each other by Fibonacci relationships. Again, it is uncanny!
There are nine planets that revolve around the sun. The order of the planets, starting with the nearest to the Sun is: Mercury, Venus, Earth, Mars, Jupiter, Saturn, Uranus, Neptune and Pluto.
(A method of remembering the order of the planets is the phrase, "My Very Easy Method, Just SUN and Pluto."
My - Mercury
Very - Venus
Easy - Earth
Method - Mars
Just - Jupiter
S - Saturn
U - Uranus
N - Neptune
And
Pluto - Pluto
Some traders use a forecasting method where the Sun is the center of the universe, called the heliocentric method.
But most astrological traders use a method where the Earth is the center of the universe, called the geometric method. This makes sense because the basis of astrological trading is that different planets shine rays onto the Earth and also the Moon has such a strong effect on our planet, (e.g. tides, calendar months being near to lunar cycles, etc.)
Interplanetary Synodic Periods
A Synodic Period is the length of time two planets meet in Conjunction, which means revolving 360 degrees to each other. The 360-degree period is divided into fractions known as the Sextile (60 degrees), Square (90 degrees), Trine (120 degrees), Opposition (180 degrees), and back to Conjunction again.
Many of the Sydonic Planetary Cycles conform to the Fibonacci Summation series (1, 1, 2, 3, 5, 8, 13, 21, 34, 55, 89, 144, etc. Ratios of 0.618, 0.382, 1.618, 2.618, etc.)
The importance of Fibonacci numbers cannot be overemphasized!
Its relationship to natural harmonic vibration is not by chance. (Also note Gann fractions of a circle and fractions of 90 recurring again!)
| Mercury – Pluto | 0.24 (Fib. 0236) | Mars – Pluto | 1.89 (Fib. 1 + Fib. 89. 1 + Gann 90/100) |
| Mercury – Neptune | 0.24 or 2 x 12 / 100) | Mars – Neptune | 1.90 (Gann 90) |
| Mercury – Uranus | 0.24 | Mars – Uranus | 1.92 (Gann 90) |
| Mercury – Saturn | 0.24 | Mars – Saturn | 2.00 (Fib. 2) |
| Mercury – Jupiter | 0.24 | Sun – Mars | 2.13 |
| Mercury – Mars | 0.27 | Mars – Jupiter | 2.23 (Fib. 2.236) |
| Sun – Mercury | 0.31* (1 third) | Jupiter – Pluto | 12.45 |
| Mercury – Venus | 0.39 (Fib. 0.382) | Jupiter – Neptune | 12.78 (Fib. 13) |
| Venus – Pluto | 0.61 (Fib. 0.618) | Jupiter – Uranus | 13.81 |
| Venus – Neptune | 0.61 | Jupiter – Saturn | 19.85 |
| Venus – Uranus | 0.61 | Saturn – Pluto | 33.43 (Fib. 34) |
| Venus – Saturn | 0.62 | Saturn – Neptune | 35.86 |
| Venus – Jupiter | 0.64 | Saturn – Uranus | 45.36 (Half 90, 89) |
| Venus – Mars | 0.91 (Fib. 89, Gann 90 degrees) | Uranus – Pluto | 127.13 |
| Sun – Pluto | 1.00 (Fib. 1) | Uranus – Neptune | 171.40 |
| Sun – Neptune | 1.00* | Neptune - Pluto | 492.32 |
| Sun – Uranus | 1.01* | ||
| Sun – Saturn | 1.03* (Fib. 3) | ||
| Sun – Jupiter | 1.09* (Gann 9) | ||
| Sun - Venus | 1.59 (Fib. 1.6) |
(* Solar combinations in reality are those participated in by the earth.)
Venus-Uranus
Venus revolves around the Sun in 61% of 1 year (365 days) or 225 days. (225 was an important Gann number because 180 + 45 = 225.) These two planets possess the unique Fibonacci relationship of the 0.618 Golden Section! (225 days is also a similar number to the Fibonacci fraction 2.236!) Uranus revolves around the Sun in 84 years (Gann 7 x 12).
Jupiter-Saturn
Jupiter revolves around the Sun in 11.8 years. Saturn revolves around the Sun in 29.4 years. Their Synodic period is 19.8 years. Jupiter and Saturn are the largest planets in our solar system and Saturn is the only planet whose magnetic pull is touched by another planet – Jupiter.
Venus-Pluto
The planets of Venus and Pluto have an average Synodic period of 61.6% of one year. This is very close to a Fibonacci 0.618 Golden Mean! In other words, it takes approximately 225 days for the two planets to meet at conjunction and travel through sextile (60), square (90), trine (120), opposition (180) and back to conjunction.
Mars-Jupiter
Mars revolves around the Sun in 1.91 years. Jupiter completes its revolution in 11.8 years. Their Synodic period from Conjunction to Conjunction is 2.23 years. (A Fibonacci 2.236 number!)
Every other conjunction of Mars-Jupiter is 4 and one-third years or 233 weeks – another Fibonacci number!
Venus-Jupiter
The Synodic period of Venus-Jupiter is 0.64 years or 233 days – another Fibonacci number!
Saturn-Uranus
The Synodic period for the Saturn-Uranus combination is 45 years. (Gann one-eighth of 360 degrees of a circle or half of 90 is 45.)
Uranus makes a complete revolution around the Sun in 84 years. Saturn makes the revolution in 29 years. The difference is 55 years – another Fibonacci number!
Jupiter-Uranus
Jupiter is the largest planet in our solar system. It takes approximately 11.8 years to revolve around the Sun (near 12 years). Uranus takes 84 years (Gann 7 x12) to revolve around the Sun. The Synodic period of Jupiter-Uranus is 13.8 years – near to a Fibonacci number 13.
Squares, conjunctions and oppositions occur at intervals of 3.4 years. (Ten-times 3.4 is 34 – another Fibonacci number!) 3.4 years is 41 months, which has been regarded as a very important stock market cycle period.
Mars-Uranus
The Mars-Uranus Synodic period is 1.9 years (almost a Fibonacci number 2. Nine is an important Gann number.). Mars revolves around the Sun in 1.8 years (180 degrees / 10) and Uranus takes 84 years (7 x 12).
Mars-Saturn
The Synodic period of Mars-Saturn is approximately 2 years – another Fibonacci number.
Mercury
Mercury is the closest planet to the Sun and orbits it very quickly. In 88 days, which is one-day off a Fibonacci number 89!
Venus
Venus is the next closest planet to the Sun and orbits the Sun every 225 days. This is very close to a Fibonacci 233 and ten-times a Fibonacci 2.236 number! (Gann 180 + 45 degrees = 225.)
Planets in Signs of the Zodiac
Astrological traders use the Zodiac, which is a circle divided into 12 parts of 30 degrees, totaling 360 degrees. Each segment of the Zodiac/circle is called a sign and has its own influence.
The Earth moves around the Sun once a year to allow the Sun to pass through each of the 12 Zodiac signs.
Each planet also travels through each sign on the Zodiac. The table below shows the approximate length of time that each planet stays in each of the twelve signs of the Zodiac. (These times vary depending on the retrograde motion of the individual planet.)
| Planet | Average Time in Zodiac Sign (30 degrees of circle) |
| Moon | 2.25 days (Fibonacci 2.236) |
| Mercury | 18 days (One-third of 54, Fibonacci 55) |
| Venus | 23 days (Fibonacci 21, 2.236 x 10, Gann 2/8 of 90 is 22) |
| Sun | 30 days (One-third of 90, Fibonacci 89) |
| Mars | 46 days (Gann 45 degrees) |
| Jupiter | 365 days (Fibonacci 377, 360 degrees of a circle) |
| Saturn | 2.5 years (Gann 250%) |
| Uranus | 74 years (Gann Three-Quarters) |
| Neptune | 144 years (Fibonacci 144) |
| Pluto | 204 years (Gann 200%) |
The financial astrologer should be aware of when planets change from one sign to another. And when there are several planets in one sign of the Zodiac at one time. (For example, in October 1974 when the stock market was at a major low, four planets were in the sign of Virgo. And in August 1987 five planets were in the sign of Leo at the height of the stock market before it crashed in the autumn!)
As well as looking for planets changing from one Zodiac sign to another, the financial astrologer also looks for several lunar (phases of the Moon) events happening on the same day. For example, when there is a full moon or if the Moon’s orbit brings it to its closest point to the Earth’s equator.
The Moon takes 28 days to orbit around the Earth. The Farmer’s Almanac mentions the New Moon and Full Moon aspects as an aid in helping farmers to plant and harvest.
WD Gann and Astrology
Gann’s writings are quite ambiguous and he didn’t reveal his exact trading methods, leaving the trader to work them out for himself. However, Gann was obviously fascinated by the planets, mathematics and how they affect the markets.
Of the few clues left on his charts about Astrology, he wrote "The faster moving planets are the key" and "The retrograde motion of Mercury will affect the trend in Grain prices."
Does Financial Astrology Work?
First we know for sure that Fibonacci relationships are extremely common in stock market price relationships! I have illustrated dozens of chart patterns that show accurate Fibonacci retracements and relationships between waves.
The fact that the planets in our solar system repeatedly show Fibonacci relationships between each other is equally amazing. Do you not agree?
Important risk warning: There is risk of loss trading futures.
The information presented in this site is for informational purposes only. Investment in
futures involves a high degree of risk, your investment may fall as well as rise, you may
lose all your original investment and you may also have to pay more on the original amount
invested. Consult your broker or advisor prior to making any investment decisions. Past or
simulated performance is not a guide to future performance.
© Copyright
1999-2004 Philip Riou. All rights reserved.
Philip Riou, Futures-Investor, Mont Cuet Road, Chouet, Vale, Guernsey, GY3
5AT.
Tel: +44 (0) 1481 246035. Email philriou@futures-investor.co.uk