2014 SPACEWEATHER PAGES
JANUARY -
FEBRUARY, MARCH,
APRIL,
MAY,
JUNE,
JULY, AUGUST,
SEPTEMBER, OCTOBER, NOVEMBER,
DECEMBER
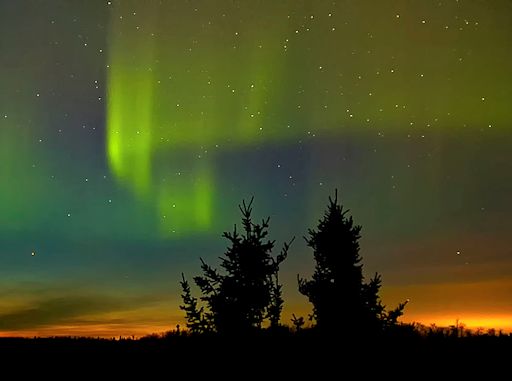
SUNSET AURORAS: Last night, April 30th, the interplanetary magnetic field (IMF) near Earth tipped south, opening a crack in our planet's magnetosphere. Solar wind poured in and ignited a display of auroras bright enough to pierce the Spring twilight around the Arctic Circle. Nancy Dean sends this picture from Sterling, Alaska
"Bright and beautiful auroras danced all night across our Alaskan sky," says Dean. "The colors of sunset made the display even better."
Meanwhile in the southern hemisphere, autumn is unfolding, and the night sky is growing darker. The display was even more dramatic there. Photographer Brendan Davey says "the glow from Tasmania was very bright."
The crack in Earth's magnetosphere has mostly closed, but the IMF could open it again. NOAA forecasters estimate a 50% chance of polar geomagnetic storms on May 1st. Aurora alerts: text, voice
5-31-14
Solar wind
speed: 336.3 km/sec
density: 10.0 protons/cm3
SUNSET SKY SHOW, CONTINUED: The crescent Moon and Jupiter are converging for a sunset sky show. When the sun goes down tonight, step outside and look for them beaming through the western twilight. The two bright bodies are less than 10o degrees apart--very pretty. [photo gallery]
CLOUDTOP PHENOMENON: For years, researchers have been studying red sprites and blue jets--strange forms of lightning that come out of the tops of clouds. On May 27th, a new form appeared. Pilot Cherdphong Visarathanonth was in the cockpit of an A320 at the airport in Bangkok, Thailand, when he saw a white tornado-like beam dancing atop this cumulonimbus cloud:
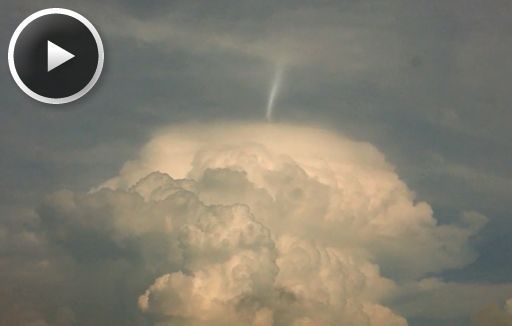
"We could see the same phenomenon through both windshields even after the aircraft has pushing back in a different direction," says Visarathanonth. "I made a 4 minute video in which we can see the phenomenon quickly moving and disappearing from time to time."
Brian Whittaker, another pilot with extensive sky watching experience, says, "I have seen Blue Jets and Sprites, but this is something totally different. Good luck figuring out what it is."
One reader suggests that it is a "jumping sundog." Lightning discharges in thunderclouds can temporarily change the electric field above the clouds where charged ice crystals were reflecting sunlight. The new electric field quickly re-orients the geometric crystals to a new orientation that reflects sunlight differently. Videos of the phenomenon show that it might be related to what Visarathanonth saw.
Other ideas are welcomed. If you have one, post it in the comments section of Visarathanonth's Space Weather Gallery page.
Realtime Space Weather Photo Gallery
7 FIREBALLS REPORTED
5-30-14
Solar wind
speed: 368.2 km/sec
density: 7.4 protons/cm3
FARSIDE EXPLOSION: The Earthside of the sun quiet, and there have been no significant flares for days. However, an uptick in solar activity might be right around the corner. On May 29th, the Solar and Heliospheric Observatory caught a farside CME rocketing over the sun's northeastern limb:
A shock wave in the leading edge of the CME emitted a strong burst of radio static. An analysis of those signals suggests that the cloud's velocity was approximately 700 km/s or 1.6 million mph. This may sound fast, but it is in fact typical for CMEs.
NASA's STEREO probes have pinpointed the blast site: It is just behind the sun's northeastern limb. In two or three days, solar rotation will bring the underlying sunspot into view from Earth. At that time, the Earthside of the sun could become active again. Solar flare alerts: text, voice
Aldabaran is easily seen below the sun in the far sky.
5-29-14
Solar wind
speed: 330.7 km/sec
density: 3.2 protons/cm3
QUIET SUN: Solar activity remains low. Not one of the sunspots scattered across the visible disk of the sun possesses the kind of complex magnetic field that poses a threat for strong eruptions. NOAA forecasters estimate a scant 5% chance of M-flares on May 29th.
COMET 209P/LINEAR FLIES BY EARTH: Today, Comet 209P/LINEAR is passing remarkably close to Earth. At a distance of only 5 million miles (0.0554 AU), it is making the 9th closest comet flyby in recorded history. Such an encounter should be good news for sky watchers. Just one problem: the comet is not only remarkably close, but also remarkably dim. Observing from Australia, Nirmal Paul needed a half-meter telescope to take this picture of the comet approaching on May 28th:
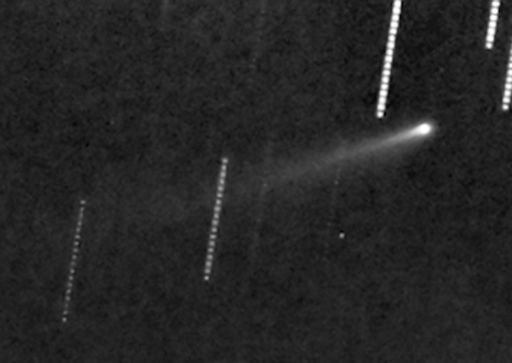
Despite its proximity to Earth, the comet is shining like a 10th or 11th magnitude star--that is, about 100 times too dim to see with the unaided eye. The comet is not very active and it currently produces very little dust. This will come as no surprise to anyone who watched the May Camelopardalid meteor shower on May 24th. Caused by dust from Comet 209P/LINEAR, the shower was a visual dud.
Amateur astronomers who wish to watch this stealthy comet pass by Earth should consult the detailed finder charts provided by Sky and Telescope. And check the comet gallery for updates:
6 FIREBALLS REPORTED
5-28-14
Solar wind
speed: 345.1 km/sec
density: 4.3 protons/cm3
15 FIREBALLS REPORTED
5-27-14
Solar wind
speed: 321.4 km/sec
density: 0.4 protons/cm3
QUIET WITH A CHANCE OF FLARES: Solar activity is low. However, departing sunspot AR2065 has developed a 'beta-gamma-delta' magnetic field that harbors energy for X-class solar flares. If such an explosion does occur, it would be well-connected to Earth. The sun's spiralling magnetic field leads from the sun's western limb, where AR2065 is located, almost directly back to our planet
FIRST NOCTILUCENT CLOUDS OF THE SEASON: Data from NASA's AIM spacecraft have shown that noctilucent clouds (NLCs) are like a great "geophysical light bulb." They turn on every year in late spring, reaching almost full intensity over a period of no more than 5 to 10 days. News flash: The switch has been flipped. "The first NLCs of the northern hemisphere season appeared on May 24th," reports Cora Randall, AIM science team member at the University of Colorado. Pale-blue and wispy, they are circled in this image of the Arctic Circle taken by AIM's CIPS instrument just three days ago:
Last year, for reasons that are not fully understood, noctilucent clouds appeared earlier than usual. In 2014, however, "we are having a fairly normal start," says Randall. "Since AIM was launched in 2007, we have seen start dates typically ranging from May 15th to May 27th, with four seasons (like this one) getting underway between May 24th and May 27th."
If this season follows the pattern of earlier seasons, the small wispy patches pictured above will grow into a magnificent ring of electric-blue clouds in 5 to 10 days--that is, by the first week of June. Then the geophysical light bulb will be fully aglow. Stay tuned for sightings.
Observing tips: NLCs favor high latitudes, but they are not confined there. In recent years the clouds have been sighted as far south as Colorado and Virginia. Look west 30 to 60 minutes after sunset when the Sun has dipped 6o to 16o below the horizon. If you see luminous blue-white tendrils spreading across the sky, you may have spotted a noctilucent cloud.
10 FIREBALLS REPORTED
5-26-14
Solar wind
speed: 321.1 km/sec
density: 0.8 protons/cm3
5-25-14
Solar wind
speed: 387.3 km/sec
density: 2.4 protons/cm3
INCREASING CHANCE OF FLARES: Solar activity ticked upward on May 24th with the eruption of an M1-class solar flare from sunspot AR2065. Sunspot AR2073 also poses a threat for M-class flares, so the weekend might not be as quiet as previously supposed. Solar flare alerts: text, voice
MAY CAMELOPARDALID METEOR UPDATE: Note to sky watchers: That's not what a meteor storm looks like. On May 24th, as predicted, Earth passed through a stream of debris from Comet 209P/LINEAR, and the encounter did produce a number of fine meteors. However, contrary to some forecasts, there was no intense outburst. Typical naked-eye meteor rates were no more than 5 or 10 per hour, a far cry from the "meteor storm" some headlines anticipated.
"Even though the meteor shower was less than spectacular, it was still nice to spend the night camping out under dark skies," says Kevin Palmer of Illinois. " I captured this fireball over the Green River State Wildlife Area at 2:24 am."
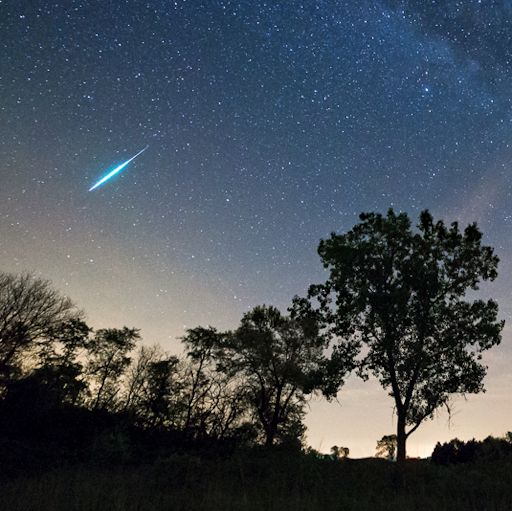
The modest display was hardly surprising. The parent comet, 209P/LINEAR, is faint and currently produces only a small amount of dust. Most forecasters acknowledged that there might be less debris in Earth's path than their models suggested.
It is worth noting, and perhaps marveling, that forecasters correctly predicted the onset of a never-before-seen meteor shower. They got the timing almost perfectly correct; only the rates were off. Such a prediction would have beeen impossible only 20 years ago before the development of physics-based dust stream models. In this respect, the May Camelopardalids were a success if not a spectacle.
19 FIREBALLS REPORTED
5-24-14
Solar wind
speed: 443.5 km/sec
density: 1.9 protons/cm3
QUIET SUN: Solar activity is low. Two sunspots (AR2071 and AR2073) have 'beta-gamma' magnetic fields that harbor energy for M-class solar flares, but both are stable. A quiet weekend seems likely
5-23-14
Solar wind
speed: 478.4 km/sec
density: 2.9 protons/cm3
ANTICIPATION BUILDS FOR TONIGHT'S METEOR SHOWER: This weekend, Earth will pass through a stream of debris from Comet 209P/LINEAR. If forecasters are correct, the encounter could produce an outburst of bright meteors numbering more than 200 per hour. Most models agree that peak rates should occur between the hours of 0600 UT and 0800 UT (2 a.m. and 4 a.m. EDT) on Saturday morning, May 24th, a time frame that favors observers in North America. It is worth noting, however, that Earth has never encountered this stream of debris before, so forecasters cannot be certain of their predictions. The display could be a complete dud, a fantastic "meteor storm," or anything in between. Whatever happens, NASA plans to chat about it.
It is often said that this is a new shower, and no one has ever seen a Camelopardalid meteor before. Well...maybe just one. "We searched through our database of several thousand bright meteors and found a likely candidate," reports Bill Cooke of NASA's Meteoroid Environment Office. "Back on May 9th of 2012, one of our all-sky cameras caught it burning up at an altitude of 66 kilometers." This is what it looked like:
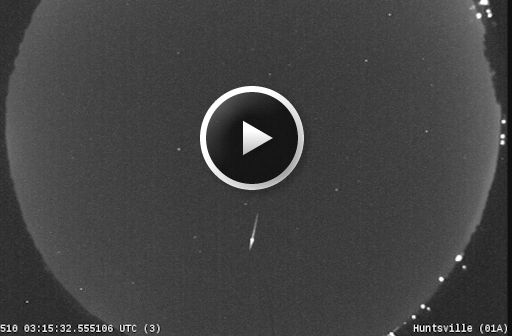
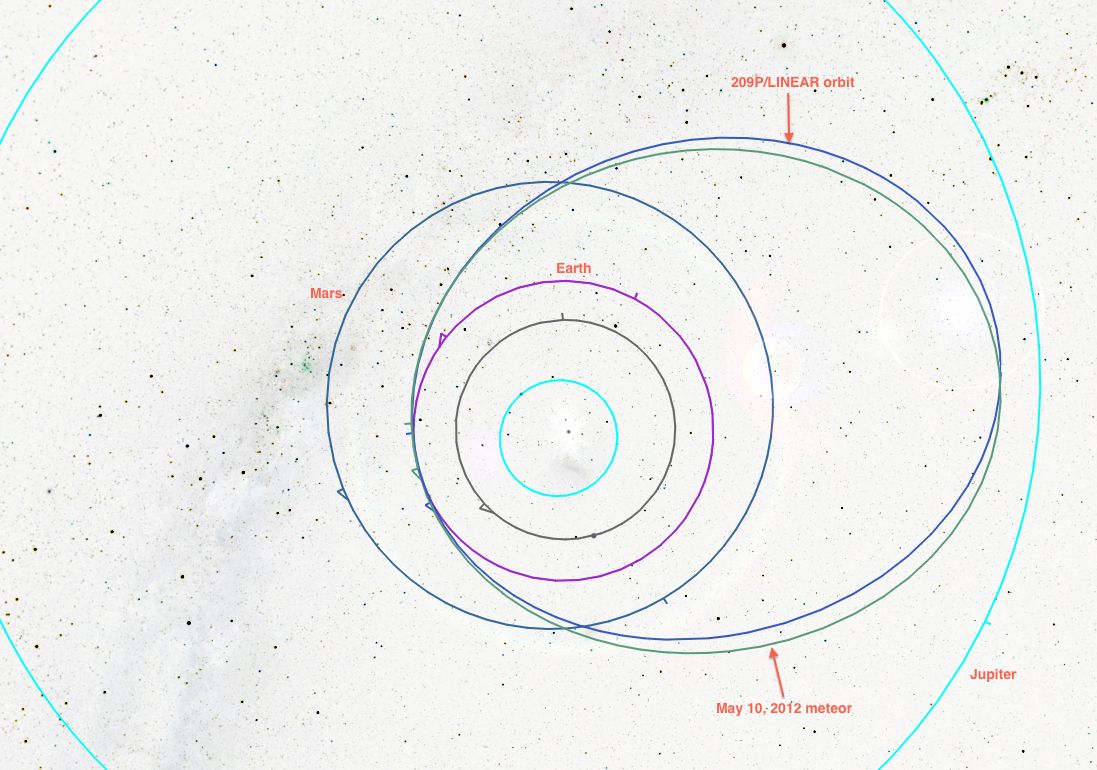
"Peaking at a magnitude of -2 (Mars brightness), our now-extinct visitor was about 3.3 cm in diameter - a little smaller than a ping pong ball," continues Cooke. "We believe it was a May Camelopardalid because it had an orbit that greatly resembles that of parent Comet 209P/LINEAR." The diagram, below, shows the match:
"So why is this good?" asks Cooke. "Looking back to 2012, our
computer models show very little comet debris near Earth. We predicted nothing,
yet got one meteor. Does this mean that a legion of his siblings will show up
this year, when the models suggest the potential of a full-fledged meteor
outburst? I'm getting excited about Friday night/Saturday morning."
Earth won't be the only body passing through the debris zone. The Moon will be,
too. Meteoroids hitting the lunar surface could produce
explosions visible through backyard telescopes on Earth. The inset in this
picture of an actual
lunar meteor shows the region of the crescent Moon on May 24th that could be
pelted by May Camelopardalids:
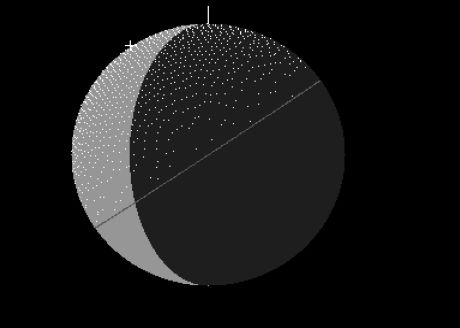
According to NASA's Meteoroid Environment Office, the best time for amateur astronomers to scan the Moon for lunar meteors is after 0800 UT (4 a.m. EDT) on May 24th.
There is much uncertainty about the strength of this shower, both on Earth and on the Moon. As far as we know, our planet has never passed directly through a debris stream from Comet 209P/LINEAR, so no one knows exactly how much comet dust lies ahead. A magnificent meteor shower could erupt, with streaks of light in terrestrial skies and sparkling explosions on the Moon--or it could be a complete dud. Stay tuned!
Realtime Meteor
Photo Gallery
[listen: meteor radar]
8 FIREBALS REPORTED
5-22-14
Solar wind
speed: 380.6 km/sec
density: 13.5 protons/cm3
QUIET SUN: Solar activity is low. Although there are more than half-a-dozen sunspots on the solar disk today, not one has the type of complex magnetic field that harbors energy for strong eruptions. NOAA forecasters estimate a 10% chance of M-flares and a scant 1% chance of X-flares on May 22nd.
20 FIREBALLS REPORTED
5-21-14
Solar wind
speed: 318.3 km/sec
density: 5.0 protons/cm3
SOLAR SECTOR BOUNDARY CROSSING: High-latitude auroras are possible on May 22nd when Earth crosses through a fold in the heliospheric current sheet. This is called a "solar sector boundary crossing," and NOAA forecasters estimate a 20% chance of polar geomagnetic storms when it occurs. Aurora alerts: text, voice
Realtime Meteor
Photo Gallery
[listen: meteor radar]
SOLAR 'MINI-MAX': Last month at the Space Weather Workshop in Boulder, Colorado, solar cycle expert Doug Biesecker of NOAA announced that "Solar Maximum is here, finally." According to his analysis, the sunspot number for Solar Cycle 24 is near its peak right now. Spoiler: It's not very impressive. "This solar cycle continues to rank among the weakest on record," says Workshop attendee Ron Turner of Analytic Services, Inc. To illustrate the point, he plotted the smoothed sunspot number of Cycle 24 vs. the previous 23 cycles since 1755:
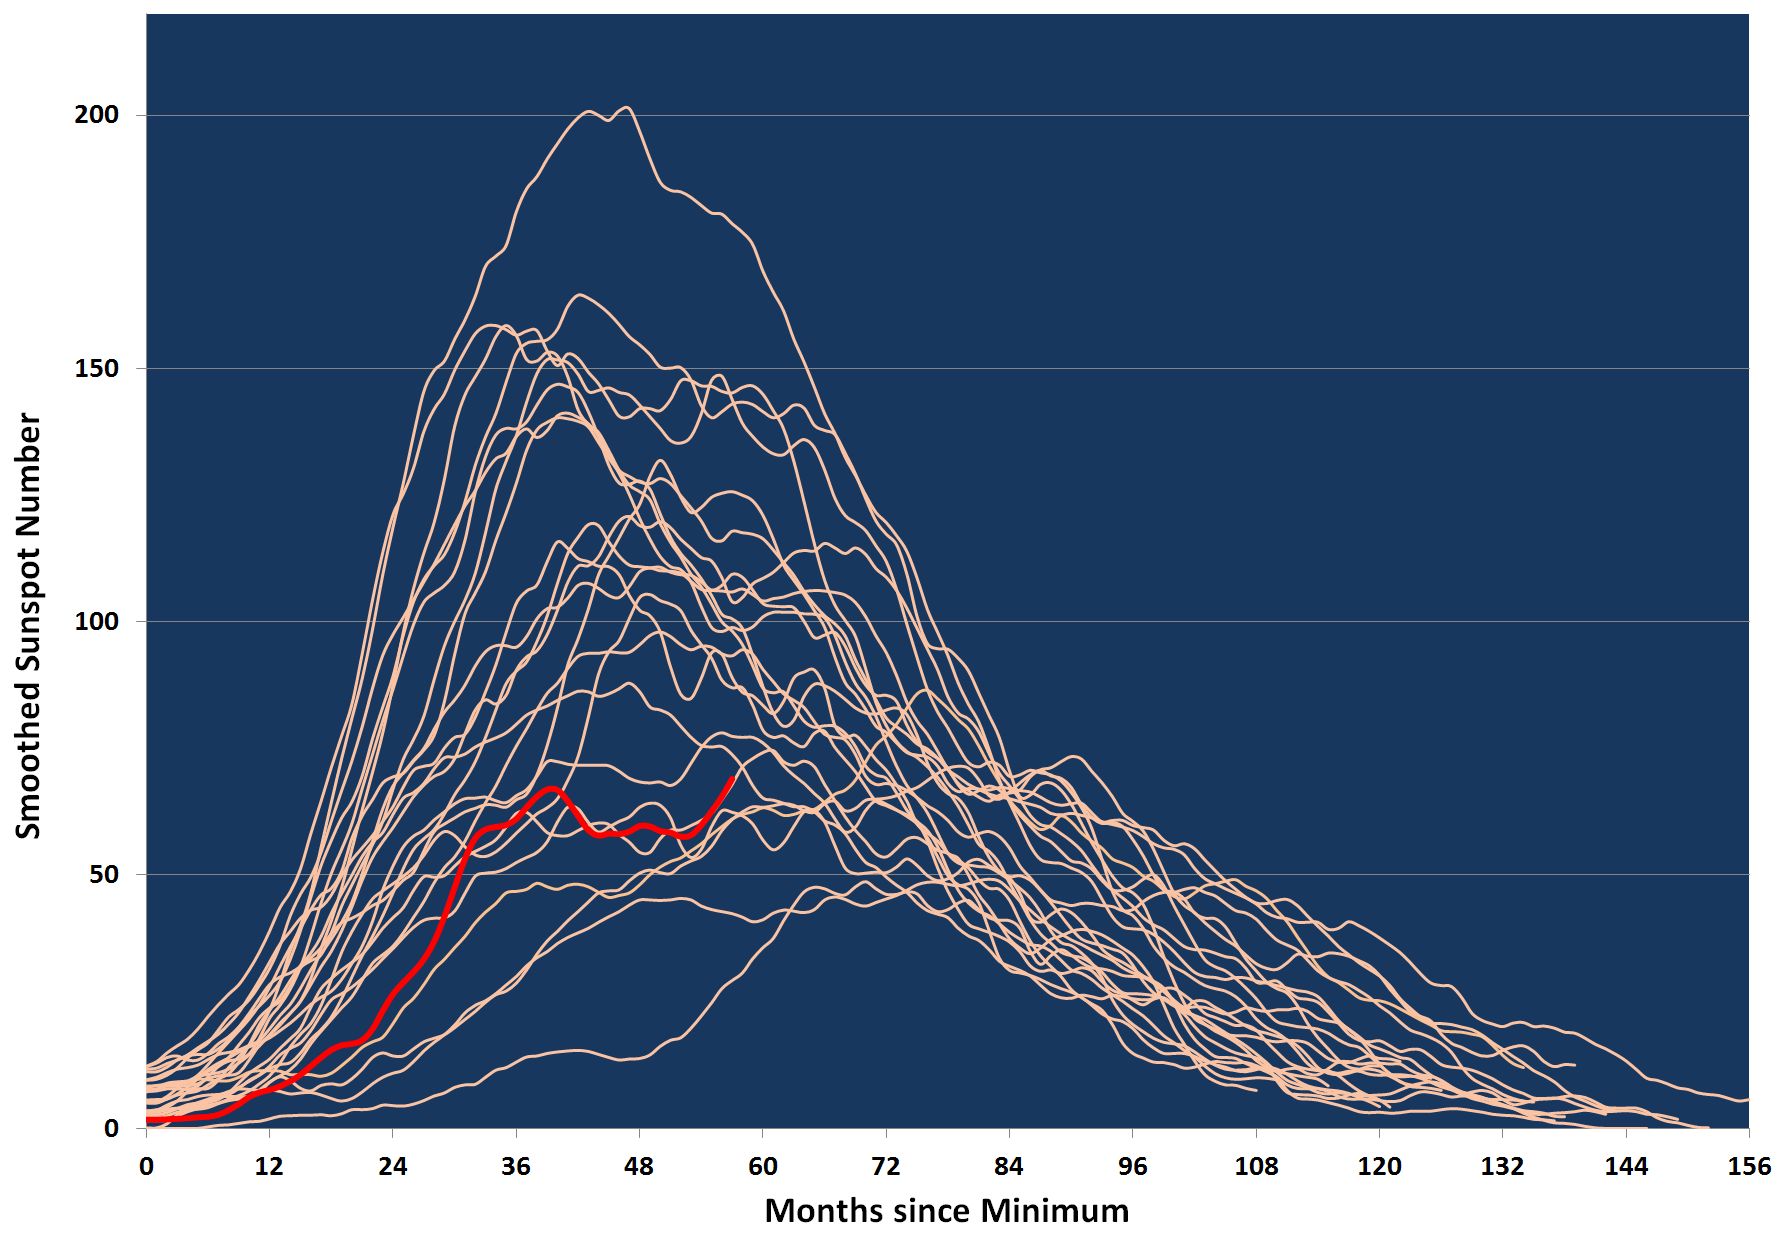
In the composite plot, Cycle 24 is traced in red. Only a few cycles since the 18th century have have had lower sunspot counts. For this reason, many researchers have started calling the ongoing peak a "Mini-Max."
"By all Earth-based measures of geomagnetic and geoeffective solar activity, this cycle has been extremely quiet," notes Turner. "However, Doug Biesecker has presented several charts showing that most large events such as strong flares and significant geomagnetic storms occur in the declining phase of the solar cycle."
In other words, there is still a chance for significant solar activity in the months and years ahead. Let's just hope it is not too significant. Solar flare alerts: text, voice
8 FIREBALLS REPORTED
5-20-14
Solar wind
speed: 336.6 km/sec
density: 2.9 protons/cm3
SOMETHING BREWING IN THE PACIFIC: According to data from the NASA/French Space Agency Jason-2 satellite, something is brewing in the Pacific. Researchers say it could be a significant El Niño with implications for global weather and climate. Get the full story from Science@NASA.
IRONIC COMET LINEAR: On May 24th, the heavens could put on a display of irony. Forecasters say Earth will cross a stream of debris from Comet 209P/LINEAR, and the encounter could trigger a bright new meteor shower. The ironic thing is, the comet is so faint:
Aaron Kingery of NASA's Meteoroid Environment Office took the picture on May 18th using a 0.5 meter telescope at the Marshall Space Flight Center. "209P is not a very photogenic comet," says Kingery. "This is the best I could do with a 60-second exposure."
How could such a dim comet produce a bright meteor shower? In 2014, 209P is producing very little dust. However, the debris Earth is about to encounter didn't come from 2014. It was shed by the comet mainly in the 19th and 20th centuries. In those days, forecasters hope, the comet was more active.
We will find out this weekend. If a magnificent meteor shower erupts on Saturday morning, it will be safe to say that the comet wasn't always so underwhelming. Get the full story and observing tips from Science@NASA.
Realtime Meteor
Photo Gallery
[listen: meteor radar]
5 FIREBALLS REPORTED
5-19-14
Solar wind
speed: 342.9 km/sec
density: 2.5 protons/cm3
5-18-14
Solar wind
speed: 339.1 km/sec
density: 4.2 protons/cm3
METEOR SHOWER ALERT: Next weekend, Earth will pass through a stream of debris from Comet 209P/LINEAR. The encounter could spark a new meteor shower. Forecasters aren't sure how many meteors will appear; anything is possible from a complete dud to a magnificent meteor storm. Best estimates fall between 30 and 200 meteors per hour on May 24th between 0600 UT and 0800 UT on May 24th. Get the full story from Science@NASA. Meteor alerts: text, voice
POLLEN CORONAS: It begins with a sneeze. Pollen floating through the air tickles your nose, and your body responds by expelling the allergen. Gesundheit!
That's German for "look at the sun." Not really, but look anyway. The same pollen that makes you sneeze can also make beautiful coronas around the sun, like this one photographed May 17th by Vesa Vauhkonen of Rautalampi, Finland:
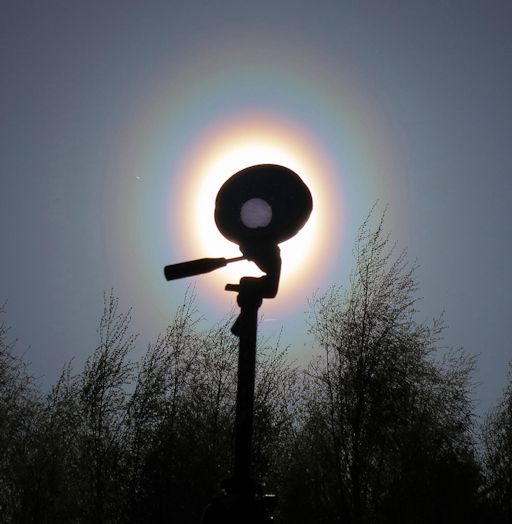
"The birch is strongly flowering now in Finland," says Vauhkonen. "This weekend we have seen soom very impressive pollen halos around the Sun."
Coronas appear when small particles scatter waves of light from the sun. Usually the particles are tiny droplets of water or ice crystals in high clouds. During northern spring, however, abundant grains of pollen can do the job, too.
"Unlike water droplets, pollens are non-spherical--and this adds to their magic," says atmospheric optics expert Les Cowley. "Many have air sacs to help carry them in the wind. These align the grains to give beautiful elliptical coronas with bright spots." This is why Vauhkonen's pollen corona looks egg-shaped instead of circular
So, the next time you sneeze... Gesundheit! ...look for coronas near the sun
FARSIDE PLANETARY CONJUNCTION: Mercury
and Saturn are in conjunction in the night sky. Just one problem: You have to be
on the far side of the sun to see it. NASA's STEREO-B probe
is perfectly positioned to observe the convergence:
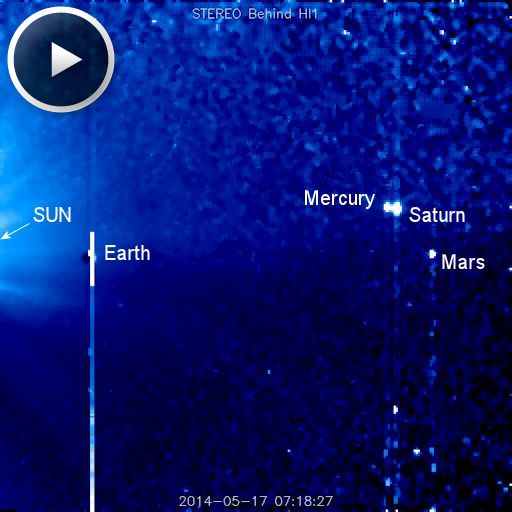
On Saturday, May 17th, the distance between the two planets was so narrow that they became nearly indistinguishable. If this event were visible from our side of the sun, it would surely be headline news.
NASA's STEREO probes see many things that we cannot. From their orbits high above the farside of the sun, they track hidden sunspots, anti-Earth-directed solar flares, and interplanetary CMEs. STEREO's wide-field Heliospheric Imagers also have a unique view of the planets. See above. This weekend's conjunction of Mercury and Saturn is bracketed by Mars and Earth itself, an arrangement impossible to observe from terra firma.
13 FIREBALLS REPORTED
5-17-14
Solar wind
speed: 352.5 km/sec
density: 4.0 protons/cm3
MOSTLY QUIET WITH A CHANCE OF FLARES: Solar activity is low. However, two sunspots have 'beta-gamma' magnetic fields that harbor energy for moderately-strong flares. NOAA forecasters estimate a 30% chance of M-flares during the next 24 hours
5-16-14
Solar wind
speed: 339.2 km/sec
density: 3.3 protons/cm3
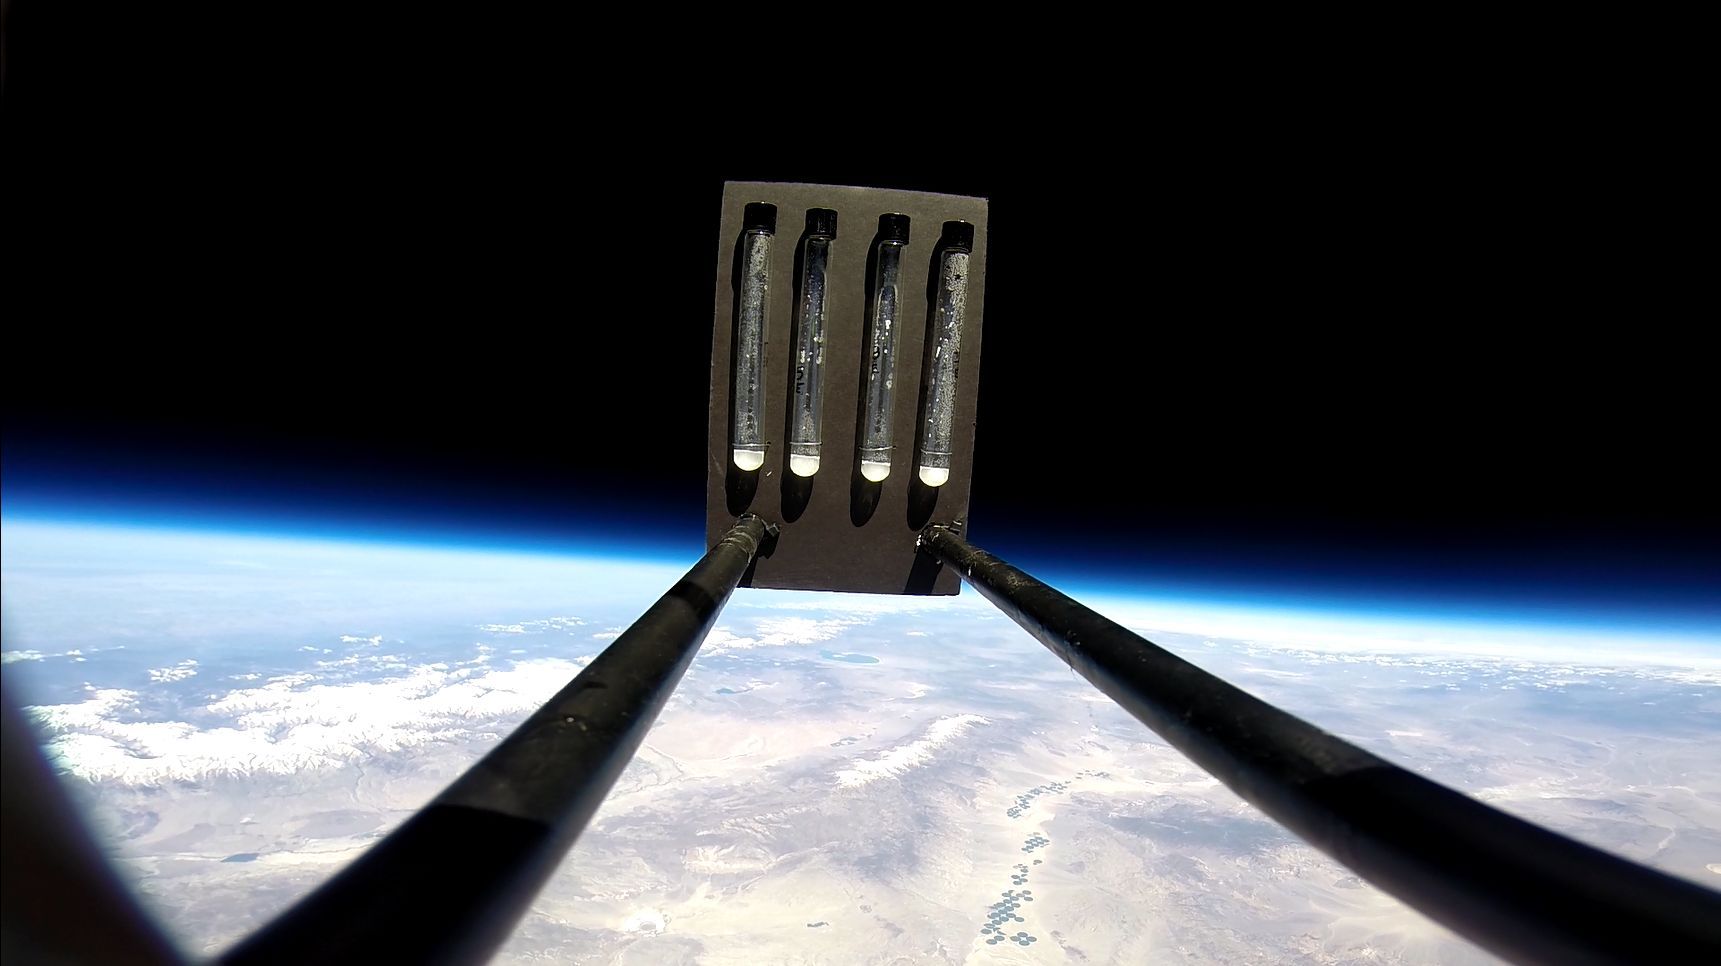
EXTREMOPHILES BLASTED BY COSMIC RADIATION: On May 10th, the students of Earth to Sky Calculus flew four colonies of halobacteria to the stratosphere, setting a high-altitude ballooning record for this species of microbe. During the two and a half hour flight, they ascended to 111,000 feet. Radiation data from an X-ray/gamma-ray sensor on the payload have just been analyzed and, suffice it to say, the microbes had a blast:
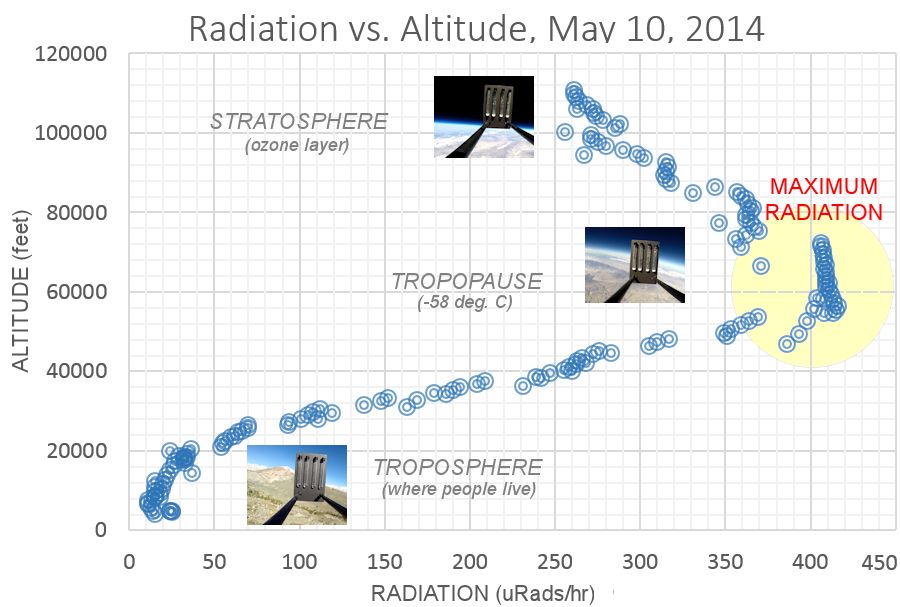
The halobacteria were hit by ionizing radiation 28 times stronger than at ground level, similar to what they might experience on the planet Mars. It might seem counterintuitive that the radiation peak did not occur at the apex of the flight. Instead, the extremophiles absorbed their greatest dose about half way up. This peak at ~60,000 feet is the "Pfotzer Maximum," named after physicist George Pfotzer who discovered it using balloons and Geiger tubes in the 1930s.
When cosmic rays crash into Earth's atmosphere, they produce a spray of secondary particles. With increasing depth in the atmosphere, primary cosmic rays decrease as the secondary particles increase. This complex situation results in a maximum dose rate in the tropopause, not the overlying stratosphere. .
The students have been flying halobacteria through the Pfotzer Maximum to explore the possibility that terrestrial extremophiles could survive in places like Mars. The answers are growing inside an incubator in the students' AP Biology classroom. Stay tuned for updates from the Petri dish.
5-15-14
Solar wind
speed: 343.0 km/sec
density: 4.1 protons/cm3
The response of lightning rates over Europe to arrival of high speed solar wind streams at Earth is investigated using a superposed epoch analysis. Fast solar wind stream arrival is determined from modulation of the solar wind V y component, measured by the Advanced Composition Explorer spacecraft. Lightning rate changes around these event times are determined from the very low frequency arrival time difference (ATD) system of the UK Met Office. Arrival of high speed streams at Earth is found to be preceded by a decrease in total solar irradiance and an increase in sunspot number and Mg II emissions. These are consistent with the high speed stream's source being co-located with an active region appearing on the Eastern solar limb and rotating at the 27 d period of the Sun. Arrival of the high speed stream at Earth also coincides with a small (~1%) but rapid decrease in galactic cosmic ray flux, a moderate (~6%) increase in lower energy solar energetic protons (SEPs), and a substantial, statistically significant increase in lightning rates. These changes persist for around 40 d in all three quantities. The lightning rate increase is corroborated by an increase in the total number of thunder days observed by UK Met stations, again persisting for around 40 d after the arrival of a high speed solar wind stream. This result appears to contradict earlier studies that found an anti-correlation between sunspot number and thunder days over solar cycle timescales. The increase in lightning rates and thunder days that we observe coincides with an increased flux of SEPs which, while not being detected at ground level, nevertheless penetrate the atmosphere to tropospheric altitudes. This effect could be further amplified by an increase in mean lightning stroke intensity that brings more strokes above the detection threshold of the ATD system. In order to remove any potential seasonal bias the analysis was repeated for daily solar wind triggers occurring during the summer months (June to August). Though this reduced the number of solar wind triggers to 32, the response in both lightning and thunder day data remained statistically significant. This modulation of lightning by regular and predictable solar wind events may be beneficial to medium range forecasting of hazardous weather.
The Sun undergoes an approximately 11 year activity cycle driven by the differential rotation rate of the solar convection zone. This differential rotation of the solar plasma distorts the solar magnetic field, gradually converting a polar field into a toroidal one throughout the solar cycle (Babcock 1961). As the magnetic field becomes more distorted, complex regions of intense magnetic field emerge through the photosphere. Observed in visible light, the emerged magnetic flux tubes with larger diameters appear darker than the surrounding photosphere and are known as sunspots. Solar influences on the terrestrial atmosphere, and, in particular, effects on electrified storms have been studied for many years, as summarized by Schlegel et al (2001). Stringfellow (1974), found a correlation between sunspot number and day on which thunder was heard ('thunder days') in the UK while other studies (Pinto et al 2013) have found an anti-correlation between solar cycle variations and thunder days. Brooks (1934) analysed data from a variety of locations and found a large variation in the relationship between sunspots and thunderstorm activity. Markson (1981) demonstrated a positive correlation between galactic cosmic ray (GCR) flux and ionospheric potential which, it has been argued, indicates a sensitivity of thundercloud electrification to ambient electrical conditions. Mechanisms have subsequently been postulated by which solar activity could influence the frequency of terrestrial lightning through modulation of the solar irradiance, the GCR flux or some combination of these two. These are discussed below.
Increase in GCR flux may directly trigger lightning through 'runaway breakdown' of electrons, leading to breakdown (Roussel-Dupré et al 2008). This is supported by recent observations of energetic photons from thunderstorms, as predicted by runaway breakdown theory (e.g. Gurevich and Zybin 2005). In a study using 16 years of lightning data over the USA, Chronis (2009) found lightning activity dropped 4–5 d after a transient reduction in GCRs (a Forbush decrease), with a positive correlation between lightning and GCRs during the winter. Before the final triggering of lightning however, an increase in atmospheric ionization may also reduce the effectiveness of thunderstorm charging processes. In the extreme case of a simulated nuclear winter, in which atmospheric ionization was assumed to be vastly increased, Spangler and Rosenkilde (1979) estimated that charging of thunderstorms would be inhibited. However, following the Chernobyl reactor accident, in which lower troposphere ionization increases occurred, an increase in lightning was observed as radioactivity passed over Sweden, so the response may be complex (Israelsson et al 1987). For example, changes in atmospheric conductivity also occur with natural variation in cosmic ray ionization (Harrison and Usoskin 2010). Hence establishing the sign of the response in lightning to GCRs may therefore be complicated by competing processes, in which different regional meteorological characteristics also play a role. The analysis here uses well-defined marker events in the solar wind to investigate the response in lighting over the UK, as detected by a very low frequency lightning detection system.
While most of the solar atmosphere is retained by gravity, energetic particles can still escape and form a continuous stream of plasma into interplanetary space known as the solar wind. There is also an extremely energetic, but intermittent, population of particles known as solar energetic protons (SEPs). The solar wind speed varies between 400 and 2000 km s−1 and is modulated by the local solar magnetic field at its point of emergence. Source regions connected to the heliospheric magnetic field (HMF) through 'open' field lines are associated with high speed solar wind streams while source regions with 'closed' magnetic topology are associated with slow solar wind streams. Despite differential rotation of the solar convection zone and surface, the magnetic field in the solar atmosphere means it rotates as if it were a solid body, resulting in a modulation of the solar wind at Earth of a period close to 27 d as fast and slow solar wind streams sweep past our planet. The passage of a fast solar wind stream also generates a temporary enhancement in plasma density and magnetic field strength of the solar wind at Earth called a 'co-rotating interaction region' (CIR) which further modulates the GCR flux (Rouillard and Lockwood 2007). Because CIRs persist for several solar rotations the decreases in GCR flux they cause tend to recur at Earth every 27 d, whereas the transient Forbush decreases do not.
Transient Forbush decreases at Earth are caused by the passage of coronal mass ejections (CMEs). A CME is generated after a reconfiguration of complex regions of magnetic field in the solar atmosphere which result in vast magnetic 'clouds' of solar plasma erupting into interplanetary space. A typical CME contains around one billion tonnes of material travelling at up to 2500 km s−1. The CMEs add to the quiet solar wind outflow driven by the high temperatures of the solar atmosphere and as CMEs and the solar wind propagate away from the Sun, they extend the solar magnetic field into interplanetary space where it becomes known as the HMF. The occurrence rate of CMEs is modulated by the solar activity cycle, with more occurring at solar maximum. The relative strength of the HMF is therefore greater at the peak of the cycle (Owens and Lockwood 2012). The HMF modulates the flux of highly energetic particles, GCRs, which are pervasive throughout the solar system. These particles have been accelerated to such high energies (typically 0.5 GeV–100 GeV) by extreme events in the Universe such as supernovae. On entering the Earth's atmosphere, these particles collide with gas particles, generating neutrons that can be detected by monitoring stations on the ground (e.g. Usoskin et al 2009). The GCR flux measured in this way is inversely proportional to the strength of the HMF, which in turn approximately follows solar activity and sunspot number (e.g. Rouillard and Lockwood 2004). The passage of a CME past Earth is known to further modulate the GCR flux as it brings with it a localized cloud of magnetized plasma. This enhanced field results in a temporary reduction in the GCR flux, (a Forbush decrease) used as marker events for comparison with lightning in the study of Chronis (2009).
While Earth-directed CMEs generate the largest Forbush decreases in cosmic ray flux, there are relatively few of these events in any given solar cycle. In their analysis, for example, Usoskin et al (2008) identified 39 strong Forbush decreases in data from the World Neutron Monitor Network since 1964. Instead, in this paper, we consider the arrival of high-speed solar wind streams at Earth from 2000 to 2005 and combine these in a superposed epoch analysis to look for a modulation in lightning rates in data from the arrival time difference (ATD) lightning detection network of the UK Met Office (Lee 1989). While these solar wind streams cause smaller decreases in GCR flux than CMEs, they are sufficiently numerous to allow a meaningful statistical analysis (for
comparison, Usoskin et al (2008) identified 14 Forbush events between 2000 and 2005).
The arrival of high speed solar wind streams at Earth can be inferred from sudden changes in the V y component of the solar wind in the Geocentic-Solar-Ecliptic (GSE) frame of reference i.e., anti-parallel with the Earth's orbital direction (e.g. McPherron et al2004; Denton et al 2009; Davis et al 2012). Here we used solar wind data from the Advanced Composition Explorer (ACE) spacecraft (Stone 1998), orbiting the L1 Lagrangian point 0.01 au upstream from the Earth in the solar wind, along the Sun–Earth line (the X direction of the GSE frame). Arrival of a high-speed stream at Earth was identified if the solar wind V y component increased by more than 75 km s−1 over 5 h. While the exact V y threshold used is arbitrary, our results are robust to different choices; the threshold described presents a good compromise, generating 532 pronounced events.
These event times were used as markers around which responses in other solar wind and geophysical parameters were averaged, which is essentially the super-posed epoch or compositing technique originally described by Chree (1908). Compositing provides a useful way of investigating weak yet repeated signals that may otherwise be swamped by larger random variations. By aligning the secondary data according to the times identified in the primary data (the 'trigger' times) and calculating the median response, random responses will average out to zero while any (even small but) consistent signal will remain. Medians rather than means are calculated to ensure that the combined result is not dominated by one or more large outliers in the data. In our study, 'trigger' times were the times at which enhancements were observed in the solar wind V y component. Repeating the analysis many times using random trigger times, the probability of whether a given response exceeds that expected by chance can be found by calculating the 95 and 99 percentiles of these random responses. The significance of any response can be further investigated by comparing the data used to calculate median values at a range of times before and after the 'trigger' time using a two-sided Kolmogorov−Smirnov test.
In our study we first ensured that we were correctly identifying the arrival of solar wind streams by calculating the median solar-wind velocity, V y, and magnetic field strength, B t from periods of data corresponding to an interval of 60 d around the trigger times identified. These times were then used to calculate the associated median variability in solar parameters (total solar irradiance (TSI), sunspot number, Mg II emission, SEP flux and GCR flux), terrestrial lightning rates and thunderstorm activity.
The speed and density of the solar wind were calculated using data from the NASA ACE Spacecraft (Stone et al 1998). The associated variations in TSI, sunspot number and Mg II emissions were used to investigate whether there was any solar variation associated with the generation of high-speed streams. The TSI data used is the PMOD composite of observations (Fröhlich 2006) which is consistent with other solar indicators and with irradiance modelling in its long-term behaviour (Lockwood and Fröhlich2008). The Mg II emission index (Heath and Schlesinger 1986) was included in this analysis as this is often used as a proxy for many UV emissions (Viereck et al 2001).
Information about the solar wind energetic particles or SEPs was obtained from the GOES dataset (GOES N Databook 2006), which combines data from several spacecraft. Proton energies are recorded in seven channels, each identified by its low energy detection threshold. They are; > 1 Mev, >5 Mev, >10 Mev, >30 Mev, >50 Mev, >60 Mev and >100 Mev.
The GCR flux incident at Earth was determined using data from the neutron monitoring station at Oulu (Kananen et al 1991). This flagship dataset is a widely-used standard within the solar-terrestrial physics community. It is a continuous, well-calibrated dataset, which, because of the station's high latitude location, records cosmic rays of energies down to the atmospheric cut-off of about 1 GeV (at lower latitudes, the geomagnetic field shielding gives higher cut-off energies).
Lightning rates were obtained from the ATD system of the UK Met Office (Lee 1989). This system uses a series of radio receivers located around Western Europe to detect the broad-band radio emission emitted by lightning. Accurate timing of the arrival of such 'sferics' at a range of stations allows the location of lightning to be determined with an accuracy of 5 km over the UK. The ATD system has been designed to have greatest efficiency in detecting cloud-to-ground (CG) lightning over Europe. The current study uses ATD data between September 2000 and June 2005, as this represents a period when the detection sensitivity of the system was not subject to modifications influencing its sensitivity. After this period the system was expanded and increased in sensitivity to form ATDnet, which detects a much larger number of smaller sferics. While the ATD system from 2000–2005 was capable of detecting lightning worldwide, the sensitivity of the network was reduced for large distances. In order to ensure some uniformity of the lightning measurements within our analysis we therefore restricted our data to any event that occurred within a radius of 500 km from central England. The time range of the ATD data used in this study encompasses 405 of the 532 trigger events identified in the ACE spacecraft data.
The presence of thunderstorm activity is also recorded at manned UK Met Office observing sites. Conventionally, a 'thunder day' is considered as any day on which thunder was heard at an observing site. While this observation is subject to false positives (such as vehicle noise or explosions being misidentified as thunder) and is of a lower time resolution compared with the lightning data, it provides an independent measure of the presence of thunderstorm activity on a given day.
After identifying when high-speed solar wind streams arrived at Earth (as described in section 3.1), these times were used to define t = 0 in all the geophysical datasets and the median response was calculated for each parameter as a function of event time t for ±60 d around this time.
Figure 1 presents the median change in solar wind parameters measured by the ACE spacecraft. The top panel shows the distribution of 'trigger' events within the epoch under consideration. As expected, the maximum number of triggers (532) is seen at event time t = 0. Plotting the distribution of triggers used in this study demonstrates that there are no other times within 60 d of the trigger time at which there is such a large number of high-speed streams arriving at Earth. This is demonstrated by the middle panel of figure 1 in which the median response in the solar wind V y component is presented. Around event time t = 0, the tangential solar wind decreases from a background level just below 0−35 km s−1 and then increases to over 60 km s−1, all within a period of around 2 d, with the greatest change at time zero. The grey band, in this and subsequent plots, represents the standard error in the median for all the data points within each time bin of the composite analysis. Outside this time window there are no other changes in V y that greatly exceed the 95 and 99 percentiles of the data (represented by the dot-dashed and dashed lines respectively) though there is a hint of the solar rotation rate with slight enhancements in V y at ± 27 d and ± 54 d. These percentiles were estimated by repeating the composite analysis one hundred times using the same number of trigger times drawn at random from within the scope of the study. The percentiles were then estimated by sorting the distributions in each time bin and ascertaining the 95 and 99 percentiles. The bottom panel of figure 1 shows the associated median change in magnetic field strength associated with high-speed solar wind streams. At t = 0, the total magnetic field strength, B t, peaks at about 13 nT compared with the background of around 6 nT. The field rapidly increases and decays over 2 d around the peak. Other than this peak around t = 0, there are no significant enhancements in the median solar wind magnetic field magnitude though again there are hints of the solar rotation rate in enhancements at ±27 d and ±54 d.
The response of solar wind parameters in a superposed epoch analysis using enhancements in ACE V y data as the trigger times, during 2000 to 2005. The top panel presents the number of triggers within each hourly time bin of the superposed epoch analysis. 532 events were identified in the ACE solar wind data corresponding to times at which the V ycomponent of the solar wind increased by more than 75 km s−1 in 5 h. Such an enhancement is indicative of the arrival of a high-speed solar wind stream at Earth. The middle panel contains the median response of the V y component of the solar wind as measured by the ACE spacecraft. In this, and subsequent plots, the median response is represented by a solid line, the standard error in this median as a grey area around the line while the dashed lines and the dotted lines correspond to the 95% and 99% levels of the dataset respectively. These percentile levels were calculated by repeating the analysis many times using random trigger times and determining the levels in each time bin that contained 95 and 99% of the data points. The lower panel contains the median response in the magnitude of the interplanetary magnetic field, B t.
Three associated measures of solar activity are compared in figure 2. The median TSI (figure 2, top panel) shows a small (0.01%) but significant decrease some 7 d ahead of the arrival of fast solar wind streams at Earth. This decrease is associated with a rise in the median sunspot number, which lasts for around 12 d. This is the time taken for half a solar rotation (13.5 d) with respect to the Earth and is likely to be caused by the appearance and rotation of active regions on the solar surface. In the photosphere, active magnetic regions manifest themselves as sunspots—darker cooler regions where the convection of the plasma has been suppressed by the strength of the local magnetic fields. Sunspots have been used as a proxy of solar activity for many hundreds of years. The peak sunspot number and minimum TSI will, on average, be when the sunspots are close to the centre of the solar disk and this occurs between t = −6 d and t = −4 d which is close to the delay expected for the (radial) solar wind from such a region to reach Earth. The complex magnetic field topology around such regions is likely to lead to areas of open solar flux along which fast solar wind streams can emerge and so it is not unexpected that the two phenomena should be linked. The bottom panel of figure 2 presents the median Mg II index of solar emission. This broad emission, centred on a wavelength on 279.9 nm, has been found to be a convenient proxy for UV emissions at other wavelengths. It presents similar behaviour as sunspot number, peaking between 8 d and 2 d before t = 0. The downward overall trends in these parameters results from this study using data from the declining phase of the solar cycle. All three of these distributions appear towards the lower end of their percentile ranges which is a consequence of a minority of triggers coming from the times of enhanced solar activity at the beginning of the study period. We have chosen not to subtract a median value from each epoch of data before calculating the median in these parameters to be consistent with the analysis of all the other parameters in which we are looking for a threshold effect where absolute values are pertinent to their relative weighting.
Figure 3 presents the response of high energy GCR and lower energy SEP fluxes to the arrival of fast solar wind streams at Earth. The top panel presents the median daily change in cosmic ray flux at Earth, as measured by the Oulu neutron counter. With the approach of the solar wind stream and its associated increase in magnetic shielding, the average GCR flux decreases by 1.4% from around 141 570 counts to a minimum of 139 571 at t = 0. This minimum is significantly outside the 95 and 99 percentiles of the dataset (the dashed and dotted lines, respectively). Before the decrease, the count rates are higher than average (just above the 99 percentile) as was shown to be a persistent feature ahead of CIR s (Rouillard and Lockwood 2007) and demonstrating that the interaction regions are significant depressors of the overall average GCR flux. The decrease starts some 5–10 d before t = 0 and the subsequent recovery to pre-event levels takes around 40 d. This is because the fast/slow solar wind interaction establishes a planar interaction front that is wound into a spiral configuration. Because of the large gyroradius of GCRs in the heliosphere, this can deflect GCRs that would have reached Earth even before it arrives at the Earth (at t < 0), but becomes a more effective shield as it passes over Earth, giving the sudden decline in fluxes seen at t = 0. As the interaction front moves outward GCRs can diffuse into its wake, giving the gradual recovery to pre-event levels that we observe.
Median response in galactic cosmic ray flux (top panel) as measured by the ground-based neutron monitor at Oulu, Finland. The second, third and fourth panels present median proton flux measurements from the GOES satellite dataset for three energy channels; >1 Mev (top), >30 Mev (middle) and > 100 Mev (lower). The median response in each parameter is represented by a solid line, the standard error in this median as a grey area around the line while the dashed lines and the dotted lines correspond to the 95% and 99% levels of the dataset respectively. These percentile levels were calculated by repeating the analysis many times using random trigger times and determining the levels in each time bin that contained 95 and 99% of the data points.
Associated with the CIRs are enhancements in SEPs. The lower panels presents a selection of energy channels (>1 Mev, > 30 Mev, >100 Mev) measured by the GOES satellites (GOES N Databook 2006). These channels demonstrate the evolution of SEP flux through the observed energy spectrum. There is a doubling in the median proton flux in the lower energy channel (>1 MeV) for 10 d around t = 0, along with subsequent smaller enhancements 27 and 54 d later. Fluxes of protons with energies exceeding 30 Mev (third panel) reveal a 9% increase in particle flux in the 3 d ahead of t = 0, dropping to a level 5% above the pre-trigger levels and decaying from this level over the subsequent 50 d. The highest energy protons (>100 MeV) are once again enhanced over the pre-trigger levels by around 9% and remain elevated for the subsequent 40 d, varying in intensity with a period of 18 d.
The top panel of figure 4 presents the median daily response in lightning rates as measured by the ATD system of the UK Met Office. Since the meteorological conditions necessary to produce lightning are not always present, these data are dominated by times for which there was little or no lightning. In order to calculate a meaningful median, these zero values were not included in our calculations by requiring a minimum mean lightning rate of one stroke per hour. This is not unreasonable since it is just recognition of the fact that convective instability must be present for lightning to occur. This reduces the number of data points included in each time bin of the composite analysis to a mean value of 135 ± 2 (of 405 trigger events) with no bin containing fewer than 93 data points, ensuring that any median value is taken from a distribution containing sufficient points that the median would not be influenced by outliers. There is a significant enhancement in median lightning rates starting 10 d before t = 0 compared with median lightning rates from earlier times. This enhanced lightning rate decays back to pre-event levels over the next 50 d. While the lightning rates remain enhanced for many days, there is a variation of around 8 d within these enhanced values and a relatively low response from t = 0 d to t = 5 d. The mean lightning rate for the 40 d before t = 0 is 321 ± 17 while the mean lightning rate for for the 40 d before t = 0 is 321 ± 17 while the mean lightning rate for the 40 d after t = 0 is 422 ± 30. A spectral analysis of the daily ATD counts revealed no significant periodicities in the original data.
Because operation of the lightning detection system depends on the propagation properties of the ionosphere, which may also be influenced by the solar changes, we also consider a less sensitive but highly robust measure of thunderstorms, manual acoustic detection of thunder on 'thunder days'. If thunder has been heard by an observer within a 24 h period, a value of 1 is recorded while the absence of thunder over the same period is recorded as 0. Such a binary measurement contains less information than a count of lightning strokes. The advantage of using such data is that it does provide an independent measure of the presence of thunder storms. Since a thunder day is a record of thunder being heard, it is potentially susceptible to other noises, such as explosions or nearby traffic, being wrongly identified as thunder. Such errors are likely to be localized and can be minimized by taking a median value across a number of stations and by setting a threshold to ensure that the results are not dominated by the measurements where little or no lightning is occurring. This threshold was set at 3% of the observed range of values to allow a similar number of (though not necessarily the same) events on average to be recorded as was seen in the daily medians of ATD lightning data (top panel, figure 4). The median fraction of stations on which thunder was heard at around 450 Met stations situated in marine and land locations across the UK is shown in the second panel of figure 4. Since the number of manned stations is expected to have varied throughout the interval being studied, thunder day counts were normalized by the number of stations known to have made manual thunder day observations each day. The number of thunder days after t = 10 is clearly enhanced compared with the number of thunder days prior to t = 10, with an encouraging agreement between the most significant peaks (exceeding the 99th percentile) and the peak lightning rates seen in the ATD data. As the thunder day data effectively records the presence of lightning with sufficient energy to generate audible thunder (Mackerras 1977), it provides an independent measure compared with the radio detection of lightning rates used by the ATD system. The mean fraction of stations recording thunder in the 40 d before t = 0 was 0.0424 ± 0.001 compared with 0.0445 ± 0.002 for the 40 d after t = 0. The significance of the enhancements in lightning and thunder day rates was investigated by conducting Kolmogorov−Smirnov tests on these distributions over 40 d before and aftert = 0. This test determines whether the two distributions represent subgroups from the same population or whether they come from statistically distinct distributions. One additional advantage of this test is that it is independent of the shape of the event distribution being investigated. For both the ATD data and the thunder day distributions, values in the 40 d after t = 0 were significantly (to confidence levels >99.9%) different from the distributions of the same parameters in the 40 d before t = 0. Using hourly triggers to identify responses in daily data can result in multiple-selection of response data in a given time bin, effectively weighting the response by the longevity of the solar wind stream. Repeating the analysis for hourly lightning data generates a similar, if noisier, response which passes the KS test at confidence levels far in excess of 99.9%. Such a reanalysis is not possible for the thunder data since it is a daily measurement. There is a sufficiently large number of trigger times within the epoch under consideration that it is highly likely that a small number of lightning data points corresponding to the same trigger time will appear in several time bins of the composite analysis. The top panel of figure 1 shows that while most trigger times are assembled at time = 0, there are a small number of triggers distributed throughout the composite time frame being considered. The fact that the lightning distributions before and after time = 0 pass the Kolmogorov−Smirnov test despite this cross-contamination of points strengthens the statistical significance of this result.
Though the selection of solar wind triggers is independent of any seasonal
changes at Earth, they could nevertheless introduce a seasonal bias into the
analysis of lightning data if they are not evenly distributed throughout the
year. Lightning rates increase dramatically in spring and decline rapidly in
autumn. Any bias in the number of trigger events between spring and autumn
could therefore potentially introduce a bias throughout the 121 d time
period of the superposed epoch analysis. This is indeed the case for the
above analysis, with more trigger events occurring in the spring (132) than
in the autumn (100) months. In order to investigate the possibility that the
observed increase in lightning rates was due to a seasonal bias, we repeated
the analysis for triggers occurring during the summer months only and
further restricted the selection of triggers to ensure that only one trigger
per day could contribute to the analysis. Given that the width of the
superposed epoch analysis window is of the order of four months, it would
still be possible, despite the restriction in trigger times, for data
outside of the summer months to be convolved in the final result. In order
to discount this possibility, no data falling outside the summer months were
used when calculating the median values in each daily time bin in the
restricted superposed epoch analysis. The results of this analysis are
presented in figure 5.
It can be seen that the responses in both daily lightning and thunder day
data are preserved and that the thunder day response is in fact more
pronounced. As before, these responses were tested using a
Kolmolgorov−Smirnov test to see if the median values for the 40 d either
side of t = 0
were drawn from different distributions. Both passed at  ⃒99.9%
(
⃒99.9%
( ⃒0.1%
probabilities that these results occurred by chance). The mean values also
passed a two sample T-test at 99.1% and ⃒99.9%
confidence levels (0.9%⃒0.1%
that these results occurred by chance) for lightning and thunder data
respectively.
⃒0.1%
probabilities that these results occurred by chance). The mean values also
passed a two sample T-test at 99.1% and ⃒99.9%
confidence levels (0.9%⃒0.1%
that these results occurred by chance) for lightning and thunder data
respectively.
Having determined that the arrival of fast solar wind streams at Earth is associated with a subsequent increase in lightning rates, some possible mechanisms can be considered. Figures 4 and 5 present evidence that lightning and thunder rates are enhanced following the passage of an interaction region over similar timescales to the observed depression in GCR fluxes reaching Earth. This appears to contradict the results of earlier studies that have indicated an anti-correlation between sunspots and thunder days (Pinto et al 2013). While sunspots themselves are merely a convenient proxy for solar activity, the mechanism for the observed anti-correlation is thought to be through the modulation of the HMF throughout the solar cycle. At sunspot maximum, the HMF is stronger, providing greater shielding from energetic GCRs at Earth. With GCRs implicated in the triggering of lightning (Roussel-Dupré et al 2008; Gurevich and Zybin 2005), this provides a mechanism by which sunspot number and thunder days would be anti-correlated over solar cycle timescales. In contrast, our study, taken from the declining phase of a single solar cycle, considers the response in lightning rates to the arrival of high-speed solar wind streams at Earth. These co-rotating solar wind streams are associated with a localized enhancement of the HMF and a concomitant drop in GCR flux that ought to, at face value, have the same effect as solar cycle variations. However the physics of these short timescale events is very different. The enhancement of the HMF is at the fast/slow stream interface in the solar wind, resulting in a relatively small (though long-lived) ~2% decrease in GCR flux. An explanation may be found in the enhancement of lower energy protons of solar origin measured in bands between > 1 Mev and > 100 Mev also associated with these high-speed streams. For those channels with higher energies (>30 Mev) these fluxes are enhanced to around 9% above pre-event levels for 40−50 d after t = 0. Of these, only higher energy particles (>500 Mev) are capable of penetrating the atmosphere far enough to directly modulate atmospheric conductivity in the lower atmosphere (e.g. Calisto et al 2012; Cliver 2006). The evolution in particle distribution seen in the energy channels presented (particle fluxes starting earlier and remaining elevated for longer as the energy threshold increases) is likely to continue beyond the highest detection threshold available on the GOES spacecraft. Furthermore, these particles, being more localized and of lower energies that GCRs, can be significantly deflected by the Earth's magnetic field, modulating their spectrum further. This could explain why the modulation of lightning rates begins before the arrival of the high-speed stream at Earth and peaks between 12 and 18 d afterwards. Particles > 500 Mev have sufficient energies to modulate the atmospheric conductivity above and within thunderclouds though they do not have sufficient energy to be detected at ground level. If these particles are subsequently responsible for the observed modulation in lightning rates it would explain why this result is in apparent contradiction to earlier studies which found an anti-correlation between sunspot number and thunder days. Studies carried out on solar-cycle timescales will be detecting the modulation of GCRs by the HMF. Enhancements of this field during times of high solar activity (large sunspot number) will shield the Earth from GCRs, reducing the rate at which they could trigger lightning. In our study however, the ~2% decrease in GCR flux is accompanied by a 9% increase in the flux of SEPs, the higher energy flux of which could penetrate the atmosphere far enough to trigger lightning in the same way that GCRs are thought to do (e.g. Gurevich and Karashtin 2013). Indeed, the sharpest drop in GCR flux around t = 0 is accompanied by a relative drop in lightning rates, indicating that the total lightning rate is in fact a convolution of triggering by two distinct populations of particles. While the exact mechanism by which this occurs is still unknown, this study demonstrates that solar wind and atmospheric conditions on these small timescales are very different from the long-term average. It is perhaps not surprising therefore that the response in lightning rates to co-rotating solar wind streams differs from that over a solar cycle.
While a small 27 recurrence can be seen either side of t = 0 in the median response in GCR flux (top panel, figure 3) no such recurrence is apparent in the lightning data (top panel, figure 4). While the arrival times of solar wind streams at Earth can be determined with some precision (figure 1), the subsequent elevation of SEPs lasts for tens of days. If this elevated particle flux is indeed responsible for the observed modulation of lightning rates, any 27 d recurrence would be blurred out in the median values of elevated particle flux and lightning rate.
Some further inferences are possible from the upgrade of the ATD lightning detection system to ATDnet which occurred in 2007 following our analysis period, which led to a much more sensitive lightning detection network for meteorological purposes. The number of lightning strokes detected increased by an order of magnitude, preventing continued detection of the solar wind effects observed between 2000 and 2005. This implies that, in the earlier period considered here, it may have been the magnitude of individual lightning strokes that was increased. Such a shift would bring more lightning strokes above the detection threshold of the ATD system and appear as an increase in the number of strokes. The lack of response in later, more sensitive ATD data is also consistent with a change in the spectrum of lightning magnitude. In the more recent ATD data the detection threshold is much lower, allowing a greater number of smaller lightning strokes to be detected. Without any record of lighting stroke magnitude however, this cannot be tested with the current dataset. A worthwhile future study would be to repeat this analysis using data from a global lightning network such as the World Wide Lightning Location Network (Rodger et al 2005).
It is, however, unlikely that the relatively small changes observed in TSI, SSN and Mg II index (figure 2) could in themselves explain the increased lightning rates through direct modulation of solar irradiance. Furthermore, if irradiance effects were the origin of the changes observed, the much greater variability apparent in these parameters throughout the eleven year solar activity cycle would be expected to modulate the lightning rates over a far greater range than has been observed.
Clearly the existence of suitable weather conditions allowing thunderstorms to form is a pre-requisite for modulation of lightning. The approximately 8 d periodicity seen in peak lightning rates after t = 0 is more comparable with the timescales of weather systems than individual storms though the cause of such a period in our observations remains unexplained. The data presented above does provide evidence that, if weather conditions are suitable to generate active convection and electrified storms, lightning rates appear to be modulated by the SEPs associated with high-speed solar wind streams. Since these high-speed streams co-rotate with the 27 d solar rotation, their arrival at Earth is predictable in advance. This, coupled with an increasing understanding of energetic particle effects on the atmosphere, makes it worthwhile pointing out the potential benefits to forecasting hazardous weather.
SEE GRAPHS ON THIS PAGE http://iopscience.iop.org/1748-9326/9/5/055004/article
5-14-14
Solar wind
speed: 334.2 km/sec
density: 5.8 protons/cm3
FULL FLOWER MOON:There's a full Moon tonight and according to folklore it has a special name: the Flower Moon. In the northern hemisphere, spring flowers are abundant in May, and the full Moon illuminates them beautifully after sunset. Take a look! [photo gallery]
A RAPIDLY GROWING SUNSPOT: A new sunspot is emerging in the sun's northern hemisphere. In less than a single day, the unnumbered active region has swollen from a barely-visible speck to a double-cored active region five times wider than Earth. The new sunspot is growing so rapidly that its magnetic field is unstable. The region's magnetic canopy is crackling with C-class solar flares, including a bright C8-flare photographed by Andy Devey of southern Spain. Stronger flares could be in the offing if developments continue apace.
62 FIREBALLS REPORTED - WOW!
5-13-14
Solar wind
speed: 338.6 km/sec
density: 6.1 protons/cm3
CO-ROTATING INTERACTION REGION: NOAA forecasters estimate a 35% chance of polar geomagnetic storms on May 14th when a co-rotating interaction region (CIR) is expected to hit Earth's magnetic field. CIRs are transition zones between fast and slow solar wind streams. Solar wind plasma piles up in these regions, producing density gradients and shock waves that do a good job of sparking auroras.
5-12-14
Solar wind
speed: 390.4 km/sec
density: 3.8 protons/cm3
VAN GOGH CLOUDS: For a moment, yesterday, June Grønseth was transported from her home in Lofoten, Norway, into the realm of Vincent van Gogh. "I looked out the wndow and saw some really big Kelvin-Helmoltz waves passing by," she says. This is one of two photos she took:
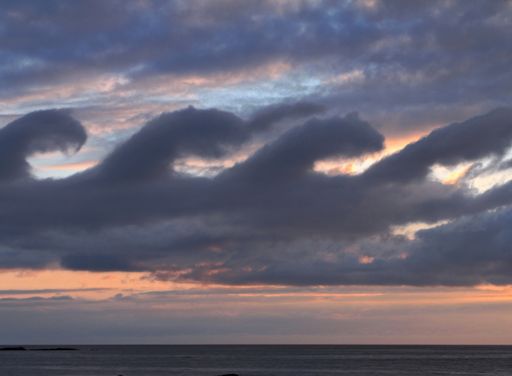
These clouds, sometimes called "billow clouds," are produced by the Kelvin-Helmholtz instability when horizontal layers of air brush by one another at different velocities. A better name might be van Gogh clouds: It is widely believed that these waves in the sky inspired the swirls in van Gogh's masterpiece The Starry Night.
9 FIREBALLS REPORTED
5-11-14
Solar wind
speed: 409.9 km/sec
density: 4.8 protons/cm3
Sunspots AR2055, AR2056 and AR2058 have 'beta-gamma' magnetic fields that harbor
energy for M-classsolar
flares.
Credit: SDO/HMI
SOUTHERN CORONAL HOLE: Imagine what it would be like if, from time to time, a hole opened up in Earth's atmosphere and air went blowing out into space. On the sun, this happens all the time. The openings are called "coronal holes." NASA's Solar Dynamics Obervatory is monitoring one right now; it is the dark wedge-shaped region in this extreme ultraviolet image of the sun's southern hemisphere:
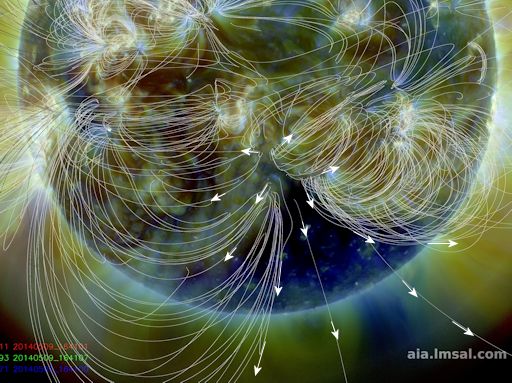
Coronal holes are places in the sun's atmosphere where the magnetic field bends back and allows gas to escape. From such openings, solar wind blows out into space. A stream of solar wind flowing from this particular coronal hole could reach Earth on May 11-12, sparking auroras when it arrives. On the other hand, the stream might sail south of our planet, delivering only a glancing blow. Stay tuned for updates. Aurora alerts: text, voice
Realtime Space Weather Photo Gallery
5-10-14
Solar wind
speed: 359.0 km/sec
density: 5.0 protons/cm3
5-9-14
Solar wind
speed: 385.9 km/sec
density: 5.6 protons/cm3
A NEW METEOR SHOWER COMING https://www.youtube.com/watch?v=Bw3hVTUQ43U
GET READY FOR A NEW METEOR SHOWER: May 24th could be a big day for meteor astronomy. That's when Earth is expected to pass through a cloud of debris from comet 209P/LINEAR, producing a never-before-seen meteor shower. Meteor rates could exceed 200 per hour, and some forecasters have even mentioned the possibility of a meteor storm
WEAK INTERPLANETARY SHOCK SPARKS AURORAS: An interplanetary shock wave, origin unknown, hit Earth's magnetic field during the late hours of May 7th. Although the weak impact did not spark a geomagnetic storm, solar wind conditions in the wake of the shock have been favorable for auroras.
"The sunset was still showing strong on May 8th when the Northern Lights came out to dance across the Alaskan sky," says Dean.
As northern spring unfolds, persistent twilight is spreading into the night skies of Alaska. It takes a bright display of auroras to be seen against such a backdrop. Dean's photo is evidence that a weak shock does not necessarily produce weak auroras.
More lights are possible tonight. NOAA forecasters estimate a 30% chance of polar geomagnetic storms as Earth exits the wake of the shock
23 FIREBALLS REPORTED
5-8-14
Solar wind
speed: 360.4 km/sec
density: 14.7 protons/cm3
AN UPTICK IN SOLAR ACTIVITY: The sunspot number is increasing this week as a crowd of dark cores emerges over the sun's eastern limb
One of the spots in the crowd, AR2056, has a 'beta-gamma' magnetic field that harbors energy for M-class solar flares. The odds of a geoeffective eruption will increase in the days ahead as AR2056 turns toward Earth. NOAA forecasters estimate a 25% chance of M-flares on May 8th.
Update: As predicted, sunspot AR2056 unleashed a M5-class solar flare on May 8th at 1007 UT. SDO captured the extreme ultraviolet flash:
The flash ionized the upper layers of Earth's atmosphere, interfering with shortwave radio propagation on the dayside of the planet. Those effects, however, quickly subsided. Also, first-look coronagraph images from the STEREO spacecraft show no significant CME emerging from the blast site
23 FIREBALLS REPORTED
5-7-14
Solar wind
speed: 345.1 km/sec
density: 8.2 protons/cm3
METEOR SHOWER UPDATE: The eta Aquarid meteor shower, caused by debris from Halley's Comet, is still active on May 7th. Incoming data from the Canadian Meteor Orbit Radar show a hot spot of meteor activity near the head of Aquarius. These meteors are best seen during the dark hours before sunrise. Set your alarm for dawn and take a look! [photo gallery] [meteor radar]
This plume of plasma, propelled away from the sun's surface by an M-classexplosion in the sunspot's magnetic canopy, is as tall as a dozen planet Earths. Much of the material escaped the sun in the form of a coronal mass ejection (CME), not Earth-directed: movie.
Stronger blasts are possible on May 7th. The sunspot has a 'delta-class' magnetic field that harbors energy for powerful X-flares. Any such eruptions, however, will almost surely miss our planet as AR2051 heads for the farside of the sun. Solar flare alerts: text, voice
5-6-14
Solar wind
speed: 346.3 km/sec
density: 2.7 protons/cm3
METEOR SHOWER PEAKING NOW: Today, Earth is passing through a stream of dusty debris from Halley's Comet, source of the annual eta Aquarid meteor shower. "The Canadian Meteor Orbit Radar (CMOR) CMOR is detecting peak activity from the eta Aquarid stream today," reports Prof. Peter Brown of the University of Western Ontario. "In our radar data, the shower shows up as a strong, point-like source emanating from the head of Aquarius."
"Activity from last night was more than 40 per hour - this is about normal for the shower as seen by CMOR but much lower than last year when rates were double this value on May 5," adds Brown.
If it's dark where you live, be alert for meteors. If the sun is up, listen for meteor radar echoes on Space Weather Radio.
Before sunrise on May 6th, Mike Taylor caught this speck of "Halley dust" disintegrating over central Maine:
"An eta Aquarid fireball meteor with an impressive green tail streaked through the sky while I was photographing the reflections of the Milky Way and some trees in a local pond," says Taylor. "I used an ISO setting of 4000 to collect as much light in the foreground reflections as possible."
28 FIREBALLS REPORTED
5-5-14
Solar wind
speed: 381.3 km/sec
density: 2.3 protons/cm3
METEORS FROM HALLEY'S COMET--TONIGHT: Earth is passing through a stream of debris from Halley's Comet, source of the annual eta Aquarid meteor shower. Forecasters expect the shower to peak on the night of May 5-6 with as many as 60 meteors per hour in the southern hemisphere and half that number in the north. No matter where you live, the best time to look is during the dark hours before local sunrise on May 6th. [photo gallery] [meteor radar]
WESTERN SUNSPOTS: Sunspot AR2051 has a 'delta-class' magnetic field that harbors energy for strong X-class solar flares. The sunspot is not directly facing Earth, which mitigates its threat. However, it is moving to a location that is in some ways even more dangerous than the Earth-facing center of the solar disk
Sunspot AR2051 is approaching the sun's western limb, which is well-connected to Earth by the sun's spiralling magnetic field. If a strong flare occurs in the next few days, particles accelerated by the blast could follow those lines of magnetic force right back to our planet. NOAA forecasters estimate a 10% chance of X-flares on May 5-6.
12 FIREBALLS REPORTED
5-4-14
Solar wind
speed: 357.1 km/sec
density: 10.6 protons/cm3
GEOMAGNETIC UNREST: Sky watchers around the Arctic Circle were surprised this morning, May 4th, when the twilight sky lit up with bands of green. "It was far from dark when the auroras appeared," says Ronny Tertnes, who sends this picture from Bergen, Norway:
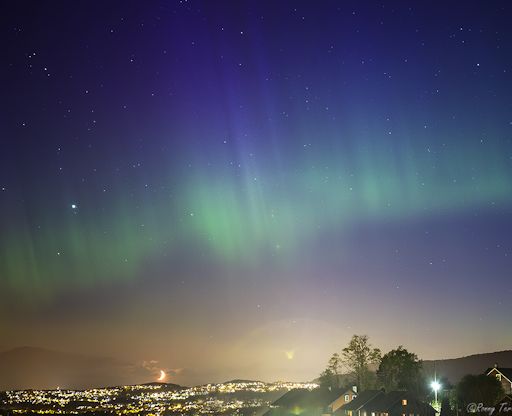
What caused this geomagnetic unrest? The interplanetary magnetic field (IMF) near Earth tipped south, opening a crack in our planet's magnetosphere. Solar wind poured in and ignited the surprise display, bright enough to pierce the Spring twilight around the Arctic Circle.
More auroras could be in the offing. NOAA forecasters estimate a 35% chance of polar geomagnetic storms on May 4-5 as the IMF continues to tip south. Aurora alerts: text, voice
6 FIREBALLS REPORTED
5-3-14
Solar wind
speed: 326.0 km/sec
density: 4.4 protons/cm3
3 FIREBALLS REPORTED
5-2-14
Solar wind
speed: 328.1 km/sec
density: 4.4 protons/cm3
INCREASING CHANCE OF FLARES: NOAA forecasters have boosted the odds of an M-class flare today to 35%. There are two possible blast sites: Earth-facing sunspots AR2047 and AR2049 both have 'beta-gamma' magnetic fields that harbor energy for strong eruptions.
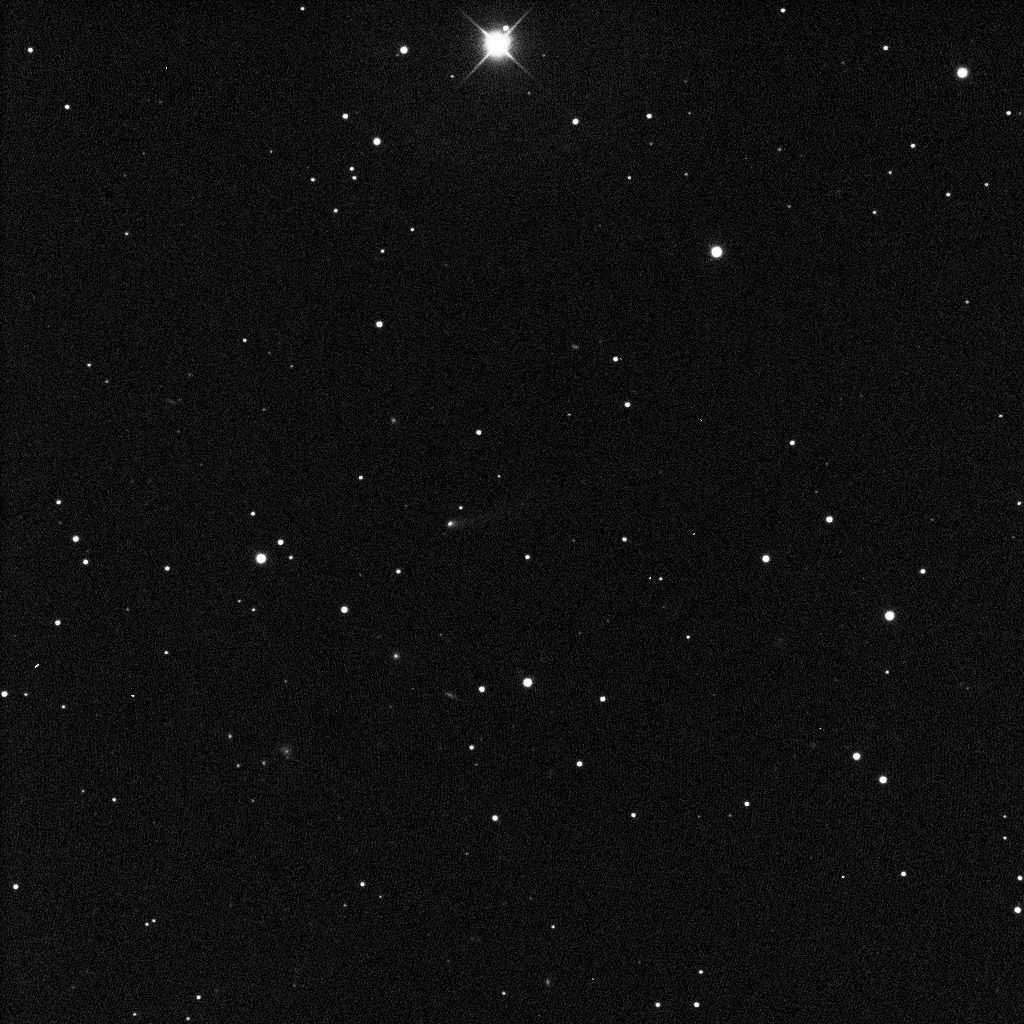
PUNY COMET, MAJOR METEOR SHOWER? On May 24th, Earth will pass through a cloud of debris from periodic comet 209P/LINEAR. The result could be a new meteor shower. Forecasters expect meteor rates as high as 200 per hour when Earth crosses the debris zone. There has even been talk of a possible meteor storm. These are lofty predictions for a comet that looks so puny:
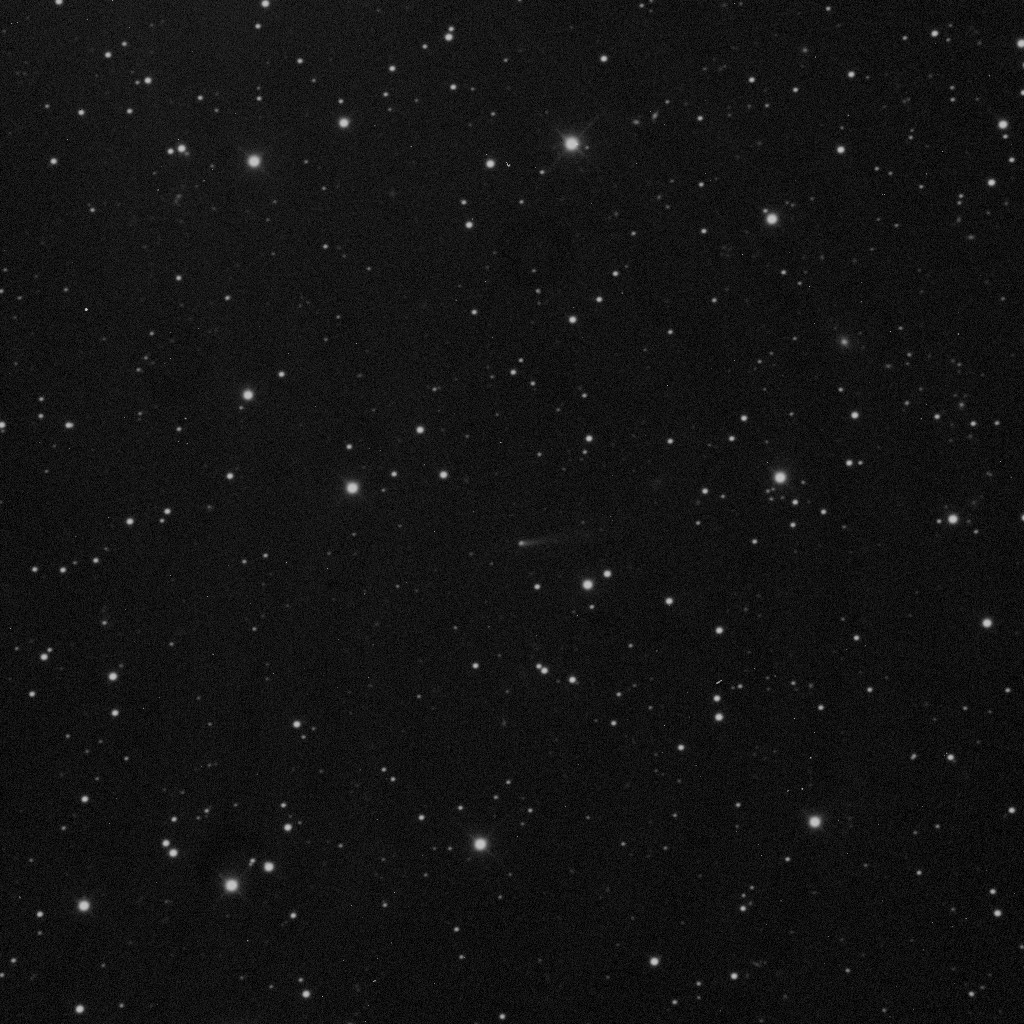
"This image was taken on April 30th (4:35 UTC) using our 20-inch telescope located in New Mexico," says Bill Cooke of NASA's Meteoroid Environment Office. "A 3 minute exposure, it shows 14th magnitude Comet 209P/LINEAR shining faintly among the stars of Ursa Major. At the time of this image, 209P was just over 40 million km from Earth, heading for a relatively close approach (8.3 million km) with us on May 29th."
The comet is faint because it is a poor producer of dust. How, then, could it create a debris cloud capable of triggering a fine meteor shower? The answer is in the timing. The debris we are about to hit was shed by the comet not in 2014 but rather in the 1800s, when forecasters think the comet was probably more active.
The best place to see the display is North America where it will be nighttime during the shower's peak. Meteors will emerge from a radiant point high in the sky, in the constellation Camelopardalis not far from the North Star. Peak rates are expected between 6:00 and 08:00 UT or 2 and 4 o'clock in the morning EDT on May 24th. No one can say for sure how strong this new shower will be; possibilities range from "storm" to "dud." Stay tuned for updates as the debris zone approaches. Meteor alerts: text, voice
3 FIREBALLS REPORTED
www.greatdreams.com/solar/2009/space-weather-may-2009.htm
May 31, 2009 ... Earth is passing through a stream of dusty debris from Halley's Comet, the source of the annual eta Aquarid meteor shower. ...
www.greatdreams.com/comets_database.htm
so when Haley's comet came by your system ... this was a major marker ... it allowed those in the unseen to know that time was at hand .
www.greatdreams.com/lostland/nasacmt.htm
The spacecraft's impact with the comet will result in a 15,000 Megatons ..... When Halley's Comet appeared in April 1066, the Anglo-Saxon Chronicle gave this ...
The final line could date the beginning of his legacy of terror around the time of the appearance of Halley's Comet (1985-86), the collision of the comet ...
5-1-14
Solar wind
speed: 377.3 km/sec
density: 5.1 protons/cm3
CHANCE OF FLARES: Growing sunspot AR2049 has a 'beta-gamma' magnetic field that harbors energy for M-class solar flares. This active region is turning toward Earth so geoeffective flares are possible in the days ahead. NOAA forecasters estimate a 20% chance of M-flares on May 1st. Solar flare alerts: text, voice
Potentially Hazardous Asteroids (PHAs) are space rocks larger than approximately 100m that can come closer to Earth than 0.05 AU. None of the known PHAs is on a collision course with our planet, although astronomers are finding new ones all the time.
|
|
|
|
| Asteroid |
Date(UT)
|
Miss Distance
|
Size
|
| 2014 HW |
Apr 27
|
2.1 LD
|
10 m
|
| 2007 HB15 |
Apr 27
|
6 LD
|
12 m
|
| 2014 HL2 |
Apr 28
|
8.8 LD
|
25 m
|
| 2014 HE5 |
Apr 29
|
9.7 LD
|
36 m
|
| 2014 HV2 |
Apr 29
|
1.4 LD
|
27 m
|
| 2014 HL129 |
May 3
|
0.8 LD
|
10 m
|
| 2014 HT46 |
May 4
|
7 LD
|
21 m
|
| 2014 HO132 |
May 5
|
2.1 LD
|
36 m
|
| 2010 JO33 |
May 17
|
4 LD
|
43 m
|
| 2005 UK1 |
May 20
|
36.7 LD
|
1.1 km
|
| 1997 WS22 |
May 21
|
47.1 LD
|
1.5 km
|
| 2002 JC |
May 24
|
48.7 LD
|
1.4 km
|
| 2014 HQ124 |
Jun 8
|
3.2 LD
|
860 m
|
|
|