GLOBAL WARMING? YES? NO?
Dee Finney's blog
start date July 20, 2011
today's date November 16, 2012
page 375
TOPIC: GLOBAL WARMING - YES? NO?
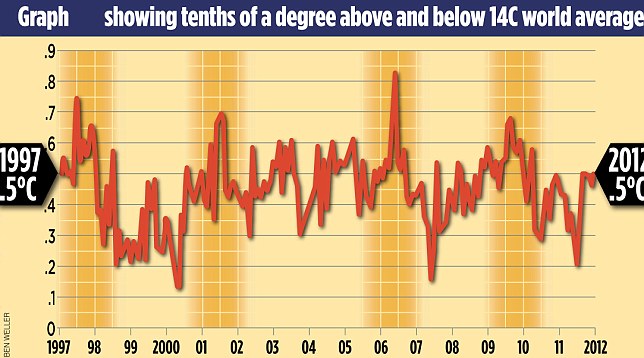
Global warming
stopped 16 years ago, reveals Met Office report quietly released... and
here is the chart to prove it
- The
figures reveal that from the beginning of 1997 until August 2012
there was no discernible rise in aggregate global temperatures
- This
means that the ‘pause’in global warming has now lasted for about the
same time as the previous period when temperatures rose, 1980 to
1996
By
David Rose
PUBLISHED:16:42 EST,
13 October 2012| UPDATED:08:59
EST, 16 October 2012
The world stopped getting warmer
almost 16 years ago, according to new data released last week.
The figures, which have triggered
debate among climate scientists, reveal that from the beginning of 1997
until August 2012, there was no discernible rise in aggregate global
temperatures.
This means that the ‘plateau’ or
‘pause’ in global warming has now lasted for about the same time as the
previous period when temperatures rose, 1980 to 1996. Before that,
temperatures had been stable or declining for about 40 years.

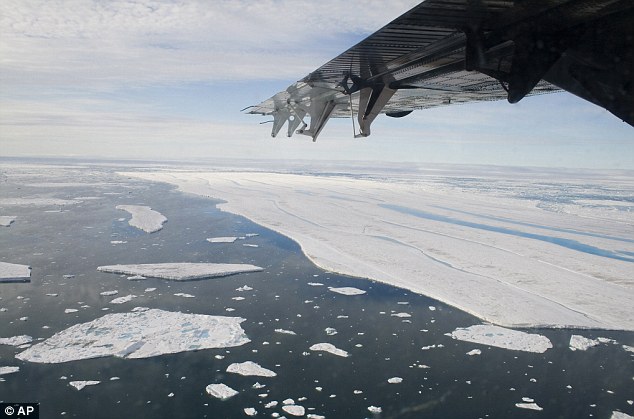
global temperature changes
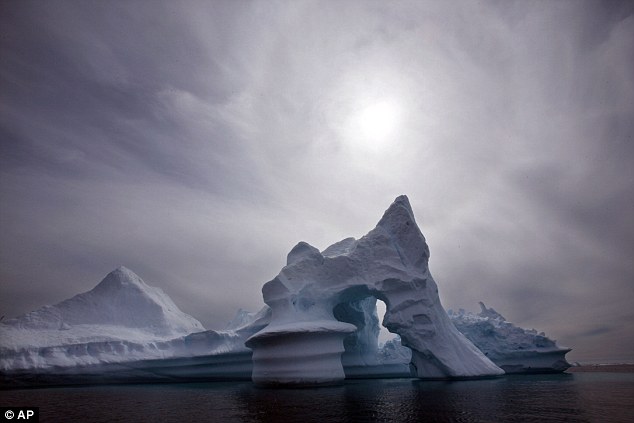
Research: The new figures mean that the 'pause' in global warming
has now lasted for about the same time as the previous period when
temperatures rose, 1980 to 1996. This picture shows an iceberg
melting in Eastern Greenland
The new data, compiled from more than
3,000 measuring points on land and sea, was issued quietly on the
internet, without any media fanfare, and, until today, it has not been
reported.
This stands in sharp contrast to the
release of the previous figures six months ago, which went only to the
end of 2010 – a very warm year.
Ending the data then means it is
possible to show a slight warming trend since 1997, but 2011 and the
first eight months of 2012 were much cooler, and thus this trend is
erased.
Wettest start to autumn for 12 years as South West continues to
be battered by torrential rain
Some climate scientists, such as
Professor Phil Jones, director of the Climatic Research Unit at the
University of East Anglia, last week dismissed the significance of the
plateau, saying that 15 or 16 years is too short a period from which to
draw conclusions.
Others disagreed. Professor Judith
Curry, who is the head of the climate science department at America’s
prestigious Georgia Tech university, told The Mail on Sunday that it was
clear that the computer models used to predict future warming were
‘deeply flawed’.
Even Prof Jones admitted that he and
his colleagues did not understand the impact of ‘natural variability’ –
factors such as long-term ocean temperature cycles and changes in the
output of the sun. However, he said he was still convinced that the
current decade would end up significantly warmer than the previous two.

Disagreement: Professor Phil Jones, left, from the University of
East Anglia, dismissed the significance of the plateau. Professor
Judith Curry, right, from Georgia Tech university in America,
disagreed, saying the computer models used to predict future warming
were ‘deeply flawed’
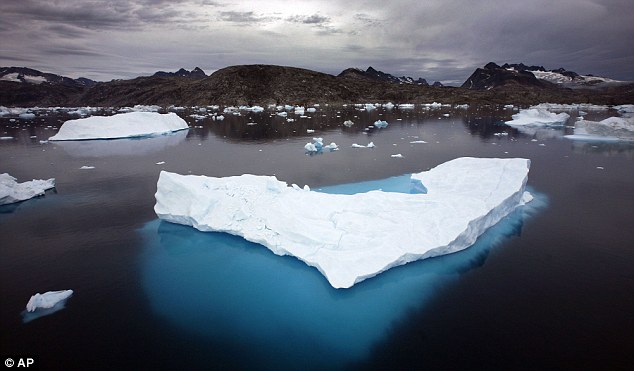
Warmer: Since 1880 the world has warmed by 0.75 degrees Celsius.
This image shows floating icebergs in Greenland
The regular data collected on global
temperature is called Hadcrut 4, as it is jointly issued by the Met
Office’s Hadley Centre and Prof Jones’s Climatic Research Unit.
Since 1880, when worldwide
industrialisation began to gather pace and reliable statistics were
first collected on a global scale, the world has warmed by 0.75 degrees
Celsius.
Some scientists have claimed that
this rate of warming is set to increase hugely without drastic cuts to
carbon-dioxide emissions, predicting a catastrophic increase of up to a
further five degrees Celsius by the end of the century.
The new figures were released as the
Government made clear that it would ‘bend’ its own carbon-dioxide rules
and build new power stations to try to combat the threat of blackouts.
At last week’s Conservative Party
Conference, the new Energy Minister, John Hayes, promised that ‘the
high-flown theories of bourgeois Left-wing academics will not override
the interests of ordinary people who need fuel for heat, light and
transport – energy policies, you might say, for the many, not the few’ –
a pledge that has triggered fury from green activists, who fear
reductions in the huge subsidies given to wind-turbine firms.
Flawed science
costs us dearly
Here are three not-so trivial
questions you probably won’t find in your next pub quiz. First, how much
warmer has the world become since a) 1880 and b) the beginning of 1997?
And what has this got to do with your ever-increasing energy bill?
You may find the answers to the first
two surprising. Since 1880, when reliable temperature records began to
be kept across most of the globe, the world has warmed by about 0.75
degrees Celsius.
From the start of 1997 until August
2012, however, figures released last week show the answer is zero: the
trend, derived from the aggregate data collected from more than 3,000
worldwide measuring points, has been flat.
Surprising: News that the world has got no warmer for the past 16
years will come as something of a shock. This picture shows drifting
ice in Canada
Not that there has been any coverage
in the media, which usually reports climate issues assiduously, since
the figures were quietly release online with no accompanying press
release – unlike six months ago when they showed a slight warming trend.
The answer to the third question is
perhaps the most familiar. Your bills are going up, at least in part,
because of the array of ‘green’ subsidies being provided to the
renewable energy industry, chiefly wind.
They will cost the average household
about £100 this year. This is set to rise steadily higher – yet it is
being imposed for only one reason: the widespread conviction, which is
shared by politicians of all stripes and drilled into children at
primary schools, that, without drastic action to reduce carbon-dioxide
emissions, global warming is certain soon to accelerate, with truly
catastrophic consequences by the end of the century – when temperatures
could be up to five degrees higher.
Hence the significance of those first
two answers. Global industrialisation over the past 130 years has made
relatively little difference.
And with the country committed by Act
of Parliament to reducing CO2 by 80 per cent by 2050, a project that
will cost hundreds of billions, the news that the world has got no
warmer for the past 16 years comes as something of a shock.
It poses a fundamental challenge to
the assumptions underlying every aspect of energy and climate change
policy.
This ‘plateau’ in rising temperatures
does not mean that global warming won’t at some point resume.
But according to increasing numbers of
serious climate scientists, it does suggest that the computer models
that have for years been predicting imminent doom, such as those used by
the Met Office and the UN Intergovernmental Panel on Climate Change, are
flawed, and that the climate is far more complex than the models assert.
‘The new data confirms the existence of
a pause in global warming,’ Professor Judith Curry, chair of the School
of Earth and Atmospheric Science at America’s Georgia Tech university,
told me yesterday.
‘Climate models are very complex, but
they are imperfect and incomplete. Natural variability [the impact of
factors such as long-term temperature cycles in the oceans and the
output of the sun] has been shown over the past two decades to have a
magnitude that dominates the greenhouse warming effect.
‘It is becoming increasingly apparent
that our attribution of warming since 1980 and future projections of
climate change needs to consider natural internal variability as a
factor of fundamental importance.’
Professor Phil Jones, director of the
Climate Research Unit at the University of East Anglia, who found
himself at the centre of the ‘Climategate’ scandal over leaked emails
three years ago, would not normally be expected to agree with her. Yet
on two important points, he did.
The data does suggest a plateau, he
admitted, and without a major El Nino event – the sudden, dramatic
warming of the southern Pacific which takes place unpredictably and
always has a huge effect on global weather – ‘it could go on for a
while’.
Like Prof Curry, Prof Jones also
admitted that the climate models were imperfect: ‘We don’t fully
understand how to input things like changes in the oceans, and because
we don’t fully understand it you could say that natural variability is
now working to suppress the warming. We don’t know what natural
variability is doing.’
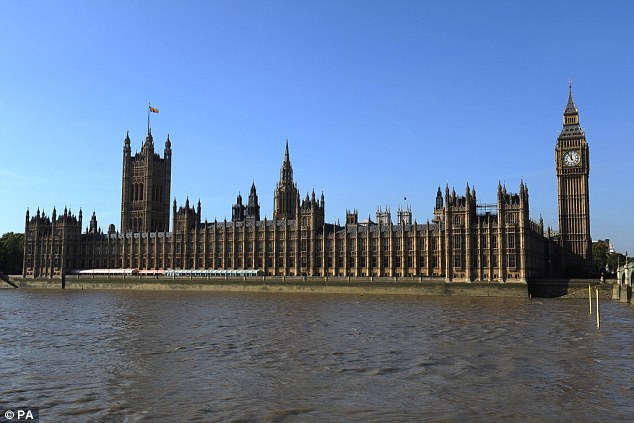
Headache: The evidence is beginning to suggest that global warming
may be happening much slower than the catastrophists have claimed -
a conclusion with enormous policy implications for politicians at
Westminster, pictured
Yet he insisted that 15 or 16 years
is not a significant period: pauses of such length had always been
expected, he said.
Yet in 2009, when the plateau was
already becoming apparent and being discussed by scientists, he told a
colleague in one of the Climategate emails: ‘Bottom line: the “no upward
trend” has to continue for a total of 15 years before we get worried.’
But although that point has now been
passed, he said that he hadn’t changed his mind about the models’ gloomy
predictions: ‘I still think that the current decade which began in 2010
will be warmer by about 0.17 degrees than the previous one, which was
warmer than the Nineties.’
Only if that did not happen would he
seriously begin to wonder whether something more profound might be
happening. In other words, though five years ago he seemed to be saying
that 15 years without warming would make him ‘worried’, that period has
now become 20 years.
Meanwhile, his Met Office colleagues
were sticking to their guns. A spokesman said: ‘Choosing a starting or
end point on short-term scales can be very misleading. Climate change
can only be detected from multi-decadal timescales due to the inherent
variability in the climate system.’
He said that for the plateau to last
any more than 15 years was ‘unlikely’. Asked about a prediction that the
Met Office made in 2009 – that three of the ensuing five years would set
a new world temperature record – he made no comment. With no sign of a
strong El Nino next year, the prospects of this happening are remote.
Why all this matters should be
obvious. Every quarter, statistics on the economy’s output and models of
future performance have a huge impact on our lives. They trigger a range
of policy responses from the Bank of England and the Treasury, and
myriad decisions by private businesses.
Yet it has steadily become apparent
since the 2008 crash that both the statistics and the modelling are
extremely unreliable. To plan the future around them makes about as much
sense as choosing a wedding date three months’ hence on the basis of a
long-term weather forecast.
Few people would be so foolish. But
decisions of far deeper and more costly significance than those derived
from output figures have been and are still being made on the basis of
climate predictions, not of the next three months but of the coming
century – and this despite the fact that Phil Jones and his colleagues
now admit they do not understand the role of ‘natural variability’.
The most depressing feature of this
debate is that anyone who questions the alarmist, doomsday scenario will
automatically be labelled a climate change ‘denier’, and accused of
jeopardising the future of humanity.
So let’s be clear. Yes: global
warming is real, and some of it at least has been caused by the CO2
emitted by fossil fuels. But the evidence is beginning to suggest that
it may be happening much slower than the catastrophists have claimed – a
conclusion with enormous policy implications.
responses below:
Read more:
http://www.dailymail.co.uk/sciencetech/article-2217286/Global-warming-stopped-16-years-ago-reveals-Met-Office-report-quietly-released--chart-prove-it.html#ixzz2COmjHhMC
Follow us:
@MailOnline on Twitter |
DailyMail on Facebook
Wind-Whipped Rains Lift Venice Tide to 6th Highest
Published: Nov 12, 2012, 0:35 PM ESTAssociated
Press
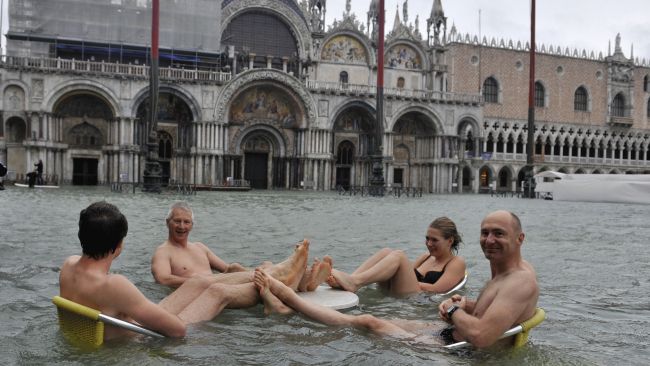
AP Photo/Luigi Costantini
People sit at the table of a bar in a flooded St.
Mark's Square in Venice, Italy, Sunday, Nov. 11,
2012.
VENICE, Italy -- Heavy rains and seas whipped up by strong
winds have flooded Venice and brought the lagoon city's high
tide mark to its sixth-highest level since records began being
kept 150 years ago.
Senior weather.com meterologist Jonathan Erdman says the
ultimate culprit for this is a deep, slow-moving upper-level
trough in the western Mediterranean Sea.
"As a result, southeast surface winds are blowing almost the
entire length of the Adriatic Sea, pushing water into Venice."
Erdman adds, "There is also, a stalled frontal boundary is
serving as a focus for heavy rain over central and northern
Italy, including parts of Tuscany."
WATCH VIDEO: WHO COULD LIVE LIKE THIS?
http://www.washingtonpost.com/world/europe/high-tide-causes-major-flooding-in-venice/2012/11/01/f4be7169-eb08-4af4-b8c4-7f02150463a9_video.html
3 more die in Italy floods; Venice waters receding
 By
Silvia Ognibene of Reuters
By
Silvia Ognibene of Reuters
Four people have now died in Italy's floods after two men and a
woman, local electricity workers, were killed when their car
fell off a Tuscan bridge.
FLORENCE, Italy — Three people died when their car fell off a
collapsed bridge Tuesday, as flooding battered central Italy for
a third straight day, forcing part of Italy's main north-south
highway to close.
Water levels were receding, however, in Venice, the lagoon
city and Unesco world heritage site that at the weekend saw its
sixth-worst flooding since records began in 1872.
St. Mark's Square, one of the lowest lying areas of the city,
where some tourists were able to swim in high water Sunday, was
returning to normal, a city official said.
The flooding alert was now centered for the area north of
Rome, where officials feared the Tiber and Aniene rivers could
burst their banks in low-lying areas outside the centre of the
capital.
The center, however, was not expected to see damage because
of high embankment walls and because the capital itself had not
been hit by heavy rain for the past two days.
The two men and one woman who died in Tuscany were local
electricity workers. Their deaths brought the toll to four in
flooding that has damaged many homes and stores as well as
thousands of acres of farmland.
One of the hardest hit areas was the Maremma zone of southern
Tuscany, where flooding washed out many secondary roads, forced
hundreds of people to leave their homes, and isolated several
towns.
A SITE DEDICATED TO FUNDING GLOBAL WARMING
Global warming facts
Basic facts are well-understood and accepted by
the scientific community
Despite overwhelming scientific evidence,
popular myths and misinformation abound.
Here are some of the facts of what we know
about global warming.
-
There is scientific consensus on the
basic facts of global warming.
The most respected scientific bodies
have stated unequivocally that global
warming is occurring, and people are
causing it.
Read their statements »
-
Scientists are certain that the
Earth is warming.
Scientists are certain the Earth has
been warming for 100 years.
Here's how they know »
-
Human activity is causing the Earth
to get warmer.
Only CO2 and other greenhouse gas
emissions from human activities explain
the observed warming now taking place on
Earth
How we know »
-
The effects of warming can be seen
today.
We can already see the effects of
global warming in our world through
disappearing habitat, shrinking arctic
sea ice and extreme weather.
Impacts we can see today »
Science sets our agenda
EDF was founded by
scientists, and we base our
work in facts and results.
See how we put science into
action »
Global warming
archives
Reports from our
science team
2007 Climate 411
blog series
How we know we're
causing global
warming
Power Politics reveals that pretty much everything we have been told about energy just isn’t true...
Available now. Click to go to Amazon Kindle Store UK (just £3.23!) or Kindle Store US - just $4.99!)and other E-publishers soon.

"An excellent, readable book for anyone who wants to know the real implications of climate madness for energy policy." Steve Goreham, author Climatism: Science, Common Sense and the 21st Century’s Hottest Topic. ..a watershed book... Donald G. Nelson
Direct (click through to page) from Continuum, Amazon US, Amazon UK and from Borders, Waterstone and all usual booksellers.
Key sites
-
The leading body of world climate scientists against climate alarmism
-
Ranking member of the US Senate Committee on Environment & Public Works
-
All that's fit to debunk.
-
An Australia-based group concerned about the science & economics of climate change.
-
A superb resource for material on GW and on broader public policy issues
-
Science writer & novelist
-
Common Sense About Climate Change
-
A Canada-based groups of climate scientists
-
Current project: Dr Tim Ball's 'Understanding climate change'
-
A newspaper concerned with real global warming science.
-
The dark side of environmentalism exposed
-
Professor Phillip Stott (EnviroSpin) on climate myths
-
A genuine presentation of all sides of the GW debate.
-
S. Fred Singer's site
-
An insightful blog by Australian John Ray.
-
A superb (US-based) online science journal which explodes the myth CO2 causes temperature rises.
-
A fine blog by L. Graham Smith which contrasts empirical data with science theories and myths
-
A research professor & environment scientist in Queensland, Aust.
-
An excellent Colorado-based weblog on the latest developments.
-
Dr Joseph D’Aleo's impressive site - he was the first Director of Meteorology at the cable
TV Weather Channel.
-
A superb resource including on GW.
-
Representing a range of scientific opinion which concludes the science on global warming is far from settled
-
A new US-based site combating the lies on climate change
-
Per Strandberg's excellent site which (among other things) debunks the infamous Hockey Graph
-
Site Editor
-
Personal site & blog. Editor based in Colchester, England
The main A-1 highway was closed in parts of Tuscany, where it
runs close to rivers.
(Writing by James Mackenzie and Philip Pullella)
PREVIOUS GLOBAL WARMING ARTICLES
-
1-11-08 - DREAM - I seemed to be on the 5th floor
of a building and I saw what looked like the sun floating past the
west window. There were flames shooting of ...
-
May 9, 2002 – Temperatures
recorded this year in the upper 500 metres (1,625 feet) of sea in
the Fram Strait -- the gap between Greenland and the ...
-
Even under moderate predictions of global
warming, the small glaciers, which make up the majority by
number, will not recover, said Prof Wilfried Haeberli, the ...
-
VS GLOBAL WARMING. 11-13-99. by Dee
Finney. On 11-13-99, I had a strange dream. It is rare for me to
dream of political figures though we watch political ...
-
They can probably expect some
global warming in about 100,000 years, after the ice
... (Global warming has boosted
freshwater runoff in the form of glacier ...
-
One example of how earthquakes
(and climate shift including so-called global warming) can
be triggered is HAARP, a U.S. military electromagnetic EM
...
-
THE CAUSE OF THE CURRENT
GLOBAL WARMING. FROM: http://users.erols.com/dhoyt1/annex10.htm.
Causes of Global Warming of about 0.5 C, 1880-1997
...
-
HYDROGEN. THE ANSWER TO GLOBAL
WARMING? THE DREAM AND THE REALITY. by Dee Finney. 2-13-02 -
The radio was on with Art Bell and the topic ...
-
How global warming is
having an impact. 6. Copenhagen climate change ...
Exposing the true Global Warming Hoaxers.
10. Coalition of denial: The sceptics ...
-
Oct 28, 2012 –
However, unrecognized warming from the ground,
unrecognized by any of the 'global warming' scientists
is occurring, exactly as described by ...
-
Stern stipulates that the action
needed to curb the effects of global warming would have to
be conducted on a global scale. Every country would have to band
...
-
Sep 20, 2012 –
Humanity has caused global warming, and
day by day the dangers are growing into a planetary emergency. Our
polar icecaps are melting at ...
-
He said despite warnings that
global warming would melt glaciers and raise the sea level,
Venetians had historically faced exceptionally high tides, with many
...
-
Well it already is happening all
over the planet in the form of pollution, global warming,
earthquakes, volcanic eruptions and much more. Prediction tries to
place ...
-
Feb 8, 2012 –
First, they attended numerous meetings on the Al
Gore-spawned global warming hoax, exposing it as a racist,
genocidal attack on the ...
-
Feb 10, 2004 –
The information is supported by the things I have
discovered while doing separate research on global warming
and the catastrophic eruption of ...
-
Aug 9, 2012 –
Vitter grilled Holdren during the hearing, asking
him to clear up his 1986 prediction that global warming was
going to kill about 1 billion people ...
-
Apr 5, 2012 –
Trenberth also elaborates on the link between
tornadoes and climate change in a recently published paper, which
notes that "Global warming ...
-
That's a view in contrast to world
climate experts who made up the Intergovernmental Panel on Climate
Change. They reported in February that global warming
...
-
While global warming is
being officially ignored by the political arm of the Bush
administration, and Al Gore's recent conference on the topic during
one of the ...
-
changes, one being the global
warming with its natural consequence – the ...
Nowadays, identical phenomena (global warming
and volcanoes activation) also ...
-
Global warming
contributes to the problem, making many dry areas drier, scientists
say. ... The Global Change Research
Program says global warming could ...
-
The report, plus other work
finding that desert valleys on the continent have cooled recently,
appear to contradict predictions that global warming is
melting the ...
-
A LITTLE ICE AGE FOLLOWS
GLOBAL WARMING ... HYDROGEN -THE
ANSWER TO GLOBAL WARMING? ...
JACK KEMP DREAM VS GLOBAL WARMING
...
-
Apr 7, 2012 –
Calculated as carbon dioxide equivalent (CO2e)
using the relevant 100-year global warming potential
(GWP100)." Greenhouse gases can be ...
-
AUSTRALIA TOLD TO EXPECT REFUGEES
FROM GLOBAL WARMING AFP ... The conservationists currently
visiting Australia say climate change is raising ...
-
3-19-2002 - GLOBAL WARMING
PAGE YOU CAN TRACK IT HERE! ...
6-8-00 - GLOBAL WARMING ISN'T REALLY HAPPENING DEPENDS ON
WHEN YOU ...
-
GLOBAL WARMING - 2003 -
2004 - 2005 compiled by Dee Finney DO NOT ... "We may already
be seeing ... THE MYSTERY OF
GLOBAL WARMING. Asia: High ...
-
That might even mean plugging your
noses and agreeing to work with the nuclear loving, tree-hugging
fake CO2 global warming crowd. If we isolate the truly
...
-
Jul 15, 2012 –
THE CHANGING SUN - CAUSING GLOBAL WARMING
... A LITTLE ICE AGE FOLLOWS GLOBAL
WARMING · APACHE NATIVES DATABASE ...
-
Apr 20, 2008 –
"This is a collision of breakthrough technology, a
demand for bamboo products and global warming. I didn't
have the brilliant foresight to see it, ...
-
Weather is going crazy around the
world and all the mainstream media talks about is "climate change" "global
warming"...etc. But they won't touch upon the True
...
-
He moved on to global warming
and now is considered an expert on the subject. ...
It is a powerful warning whether or not you believe
that global warming is the ...
-
... Hot Air and the Global
Energy Crisis. Portobello Books. ISBN 1-8462-7004-9. Leggett Jeremy.
The Carbon War: Global Warming and the End of the Oil Era.
NOTE: THERE IS NO SUCH THING AS PEAK OIL - OIL KEEPS MAKING
ITSELF FROM ITS OWN EARTH FORCES
-
Today, even as the Bush
Administration belittles global warming, the prospects of a
worldwide warm-up may make nuclear power seem sweet by comparison.
-
They're also leaving at the wrong
time, because global warming is giving them false signals.
It's become important for scientists to understand how birds
...
-
... for the economy, or it
might be a wash. So we don't really know if global warming
is really occurring; if it is, we don't know ...
-
If global warming only
took 40 years, how would we prepare for that? What if we had several
years in a row when rainfall was less than normal? We would have
...
-
Oct 17, 2006 –
PREDICTIONS OF ANOTHER TSUNAMI · GLOBAL WARMING
- NEW EVIDENCE · DEAD JOURNALISTS · YELLOWSTONE SUPERVOLCANO
...
-
Global Warming Melts
Winter Joy at Top German Resort <http://www.planetark.com/dailynewsstory.cfm/newsid/29086/story.htm>
HURRICANES / TYPHOONS ...
-
Jan 2, 2006 –
From this perspective, we may be on the verge of
dramatic changes in our climate due to global warming, but
the full effects of these are still ...
-
May 2, 2012 –
Undo ... of how we might have been should fate and
time and geography have made ... Global warming,
deforestation, mass species extinction, ...
-
Apr 15, 2012 –
GLOBAL WARMING - 2004 - 2009.
www.greatdreams.com/warming3.htm - Similarto GLOBAL
... THE MYSTERY OF GLOBAL WARMING
...
-
Feb 13, 2012 –
Deforestation contributes to the worldwide green
house effect of global warming. In the U.S., among the most
severe problems are water ...
-
Global Warming Newswatch
..... Dangers are carbon dioxide and methane
gases, greenhouse gases leading to global warming,
photo-chemical production of ...
-
GLOBAL WARMING - 2003 -
2004 - 2005. Native leaders say salmon are increasingly
... THE MYSTERY OF GLOBAL WARMING. Two
Alaskan native villages, ...
-
May 2, 2009 –
Environmentalists opposed to the treaty say that
those who do believe in global warming continue to hope
that proof is just around the corner.
-
Sep 20, 2011 –
GLOBAL WARMING.
http://search.yahoo.com/search;_ylt=A0oGdV9ZlnhOISwAiYZXNyoA
...
-
global warming / housing
/ health / industry / intercultural. exchange / interfaith action /
intergenerational projects /. international law / internet / land
use ...
-
Dec 17, 2011 –
It has a high global warming potential: 72
times that of carbon dioxide over 20 years, and 25 times over 100
years, and the levels are rising.
-
Oct 22, 2012 –
(See
http://en.wikipedia.org/wiki/South_Atlantic_Anomaly ) Global
warming that's been ongoing for 400 years correlates with
expansion of the ...
-
Nov 18, 2011 –
They can probably expect some global warming
in about 100000 years, after the ice melts that's going to cover
Canada. This is the meaning of ...
-
The primary tools that Agenda 21
Sustainable Development uses are global warming lies, water
shortages (like the man made drought in California, which also
...
-
Even if the global superstorm
doesn't hit us, many people believe that global warming
will effect our planet in a very negative way. Killer Asteroids .
-
Russian scientists further warn
that the West's “obsession” with manmade Global Warming is
a deliberately designed propaganda effort to shield their peoples
...
-
One example of how earthquakes
(and climate shift including so-called global warming) can
be triggered is HAARP, a US military electromagnetic EM .
NOTE: HARRP IS BEING USED TO STEER HURRICANES AS WELL. THIS
INCLUDES KATRINA, AND SANDY OF 2012
-
But a number of highly respected
scientists, who were not in on the "coverup," rejected totally the
theory of "global warming." Rather, they [rightly] pointed
out that ...
-
The Anunnaki Remnants are confused
by the clearing of the planet by such means as global warming,
volcanoes, fires, wars, and etc. They thought that these
...
-
But years of drought, which some
blame on global warming, have savagely depleted the huge
dams built 60 years ago to hold the snow melt from the Australian
...
-
Sep 13, 2012 –
'Global Warming' is Killing Us - And It's
Designed To. - Guatemalan Sexually Transmitted Disease Medical
Experiments - Were Just One Crime ...
-
DREAMS OF GLOBAL WARMING.
Tsunami. TSUNAMI IN OUR FUTURE ... Nature of Tsunami. The waves
created by a sudden disturbance in the ocean are ...
-
Jun 13, 2000 –
Guiding Principles | Global Warming | Gang
Stalking | Monoatomic Gold · Hope | Healing Thought Forms | Vanquish
Fear | Hydrogen Peroxide ...
-
DREAMS OF GLOBAL WARMING.
Tsunami. TSUNAMI IN OUR FUTURE ... Nature of Tsunami. The waves
created by a sudden disturbance in the ocean are ...
-
Canada Weather · Earthwatch -
Weather on Command · Global Warming - Early Warning Signs ·
-
The important debate on global
warming under UN auspices provides but a partial picture of
climate change; in addition to the devastating impacts of
...
-
Predictions that global
warming will be greatest in the polar regions are now being
borne out. Arctic sea ice has been shrinking by 3% each decade since
1970.
-
Jun 8, 2004 –
The planet is apparently condemned to an eternal
cycle of global warming, with surface temperatures that
hover around 480C. There are ...
-
Dec 27, 2010 –
Weather is going crazy around the world and all the
mainstream media talks about is "climate change" "global warming"...etc.
But they won't ...
-
Mar 26, 2000 –
El Niños have become more frequent and
progressively warmer over the past century, and new data and
analysis suggest that global warming ...
-
JACK KEMP DREAM VS GLOBAL
WARMING · JACK KEMP POLITICAL POLICIES · LAWRENCE OF ARABIA WAS
WRONG ... www.greatdreams.com/contents.
-
The trend is cyclical, and has
nothing to do with pollution blamed for global warming,
Gray said. "There's tremendous ignorance about how these storms go,"
he ...
-
But because of man-made global
warming, most hurricane scientists say now we will probably be
getting Category 4 and 5 hurricanes more frequently in the
...
-
May 9, 2001 –
Stephen Greer stated that we CAN end global
warming and pollution. We can do this gradually, with no loss
of jobs to anyone, through ...
-
They also expressed confidence
that Bush could be pressed into backing some kind of "global
warming" pact that would enhance UN control of the world.
-
Feb 23, 2012 –
global warming. Noctilucent clouds are a
fundamentally new ... www.wired.com/wiredscience/2009/07/nightclouds/
- 70k - Similar pages ...
-
... these ups and downs to
natural weather and climate variations and distinguish their subtle
effects from the larger pattern of human-caused global warming.
-
Oct 12, 2011 –
Some of the profits from the Live Earth concerts,
and profits from the associated book - The Live Earth Global
Warming Survival Handbook, will ...
-
GLOBAL WARMING: From 2002
to 2008, decreasing solar irradiance has countered much
anthropogenic warming of Earth's surface. That's the conclusion of
...
-
DREAMS OF GLOBAL WARMING.
Tsunami. ... www.greatdreams.com/drought_and_heat.htm. PUZZLES
108 is the number of names of the Goddess in India, ...
-
First to the people of London, and
now at the G8 summit, where their topic Number 1 --believe it or
not-- was global warming, the second was African aid.
-
about global warming,
nuclear proliferation, terrorism, Bible codes, the Four Horsemen of
the Apocalypse or gay marriage. Regardless of what many people .
-
Jul 24, 2002 –
SEE GLOBAL WARMING ......
Sea level changes caused by global warming
could trigger the eruption of hundreds of new or dormant volcanoes
...
-
Dec 28, 2006 –
Edwards - who is calling for cuts in poverty,
global warming and troops in Iraq - chose the site to highlight
his signature concern of the economic ...
-
End of the Age · End of Time ·
EZEKIEL · FLOODS · Games of Slaughter · 2006 · GEMATRIA · GENEALOGY
· GLOBAL WARMING · GNOSTICS · 2007 · HAARP ...
-
Feb 2, 2007 –
Perilous Times and Global Warming 14
killed by fierce tornadoes in central Florida* By Barbara Liston
ORLANDO, Florida (Reuters) - Fourteen ...
-
The Opposition Leader, Kevin Rudd,
said the crisis proved the need for greater action on global
warming. "It's not the Howard Government's fault in itself. I
mean ...
-
Global warming “Depending
on the sea temperature and the wind speeds, it is then expected to
gather force before hitting the US,” he warns. Charley was
...
-
Nov 24, 2005 –
As officials from nearly 180 nations start to
gather Monday in Bonn, Germany, to confront the vexing problem of
global warming, the issue is no ...
-
Feb 10, 2009 –
Global warming can't be blamed for
specific fires, but it creates conditions that foster larger and
more frequent wildfires, scientists say.
-
Did it suffer from a case of
global warming run amok – or something else? When Akatsuki
reaches Venus in December, it will begin to solve some of the
...
-
Yup, global warming is
happening and humans seem to be to blame, according to an early
draft of a long-awaited report from the Intergovernmental Panel on
...
-
Feb 13, 2001 –
EPA APPD - U.S. EPA Atmospheric Pollution
Prevention Division EPA - GLOBAL WARMING - The US
Environmental Proteciton Agency ...
-
Apr 25, 2008 –
Aside from ethanol we've seen rising demand as well
as crop failures in various parts of the world because of drought
and global warming ...
-
Dec 1, 2006 –
"Energy security will revitalize rural America,
reestablish our moral leadership on global warming," he
said. On Iraq, he said it is time to begin to ...
-
Natural Disaster, Lifelong -
Possible scenarios include: severe global warming and the
coming ice age, the greenhouse-effect-gone-wild, ...
-
Feb 17, 2006 –
Global warming is expected to result in
more extreme weather because of changes in atmospheric wind patterns
and the ability of warmer air to ...
-
GLOBAL WARMING - 2003 -
2004 - 2005 compiled by Dee Finney DO NOT . .....
suspect were caused by global warming and
the El Nino weather phenomenon, ...
You've visited this page 3 times. Last visit: 8/7/10
-
... for the APEC summit in
Singapore that next month's conference in Copenhagen, Denmark, is no
longer likely to yield a major accord to battle global warming.
-
Jun 27, 2001 –
About 23 million years ago, a huge ice sheet spread
over Antarctica, temporarily reversing a general trend of global
warming and decreasing ...
-
We have the phenomenon of "global
warming", which has been wrongly blamed on industrial
pollution. I am not, I stress, saying that pollution is a good
thing, ...
THERE WERE ACTUALLY 297 LINKS, BUT I'M GVING YOU A BREAK FROM READING
:-)
 By
Silvia Ognibene of Reuters
By
Silvia Ognibene of Reuters")
TIta Gascoin How do you know the whole world was warmer during the Middle Ages? The whole world, not just the North Atlantic Basin which is about the worst place in the world to look for an indication of global climate. If the World was so much warmer back then, how come sea levels are around 1-2 metres higher now than they were then - just ask the Ancient Romans who constructed sea water fish tanks at sea level that are all underwater now.
- Glenn Tamblyn , Melbourne, Australia, 16/10/2012 04:17